Dashboard Design
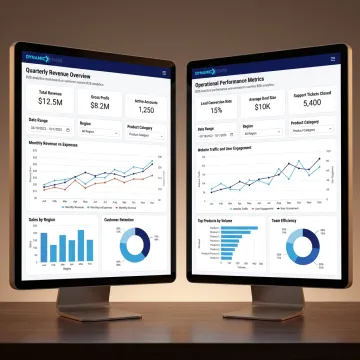
Design and build interactive dashboards that surface key KPIs, simplify monitoring, and help teams explore performance data without relying on static spreadsheets or disconnected reports.
Turn complex datasets into clear, decision-ready visuals with Dynamic Data. Our consultants design dashboards, reports, and interactive tools that help teams spot trends faster, align stakeholders, and act with confidence. From executive reporting to real-time visibility, we build visualization solutions tailored to your goals, data sources, and audience.

Explore tailored visualization, dashboard, and reporting solutions that make complex business data easier to understand and act on.
Design and build interactive dashboards that surface key KPIs, simplify monitoring, and help teams explore performance data without relying on static spreadsheets or disconnected reports.
Create tailored reports and visual summaries that organize complex information into clear, audience-specific formats for executives, managers, and operational teams.
Implement live reporting environments that update critical metrics as data changes, helping teams respond faster to operational shifts and emerging opportunities.
Develop business intelligence visualizations that connect raw data to actionable insights, enabling faster analysis, stronger forecasting, and more confident decision-making.
Build bespoke visualization tools for unique business needs, translating dense datasets into intuitive, interactive experiences that improve understanding across stakeholders.
Present insights through visuals and narrative structure that help non-technical audiences understand what the data means and what actions to take next.
Dynamic Data helps organizations turn fragmented, hard-to-read information into dashboards and reports that support faster decisions. Our consulting services combine business intelligence, custom visualization design, and reporting strategy so leaders, analysts, and frontline teams can understand performance at a glance. The result is clearer communication, less manual reporting, and more confidence in every decision backed by data.
See how organizations use our visualization expertise to improve reporting clarity and decision-making.
Businesses partner with us for visualization solutions that are strategic, practical, and built around real decision-making needs.
Our team combines BI, analytics engineering, and reporting strategy to build visuals that drive action.
We tailor dashboards, reports, and visualization tools to your goals, users, and data environment.
Expertise across 35+ platforms and languages supports scalable, reliable visualization and reporting systems.
We align every engagement to business outcomes, reducing manual work and improving decision confidence.
Experienced specialists in analytics, BI, and reporting.

CEO & Founder
Victoria Gallerano is the CEO and Founder of Dynamic Data, which she established in 2020 with a mission to transform complex data into actionable insights for businesses worldwide. A recognized expert in Business Intelligence, Artificial Intelligence, and Data Governance, Victoria founded the company to help organizations launch modern data stacks, automate reporting, and harness the power of machine learning for real, measurable results. Under her leadership, Dynamic Data has grown to a team of over 40 professionals spanning Europe, South America, and the USA. Victoria is driven by a client-centric mindset and a passion for innovation, ensuring every solution delivered is tailored to help businesses thrive in an increasingly digital world.

CTO
Diego Prinzi serves as Chief Technology Officer at Dynamic Data, where he leads a multidisciplinary team of data professionals dedicated to delivering innovative, client-driven solutions. With over 15 years of experience in software development and data engineering, Diego brings deep technical expertise and a strategic vision that empowers businesses to make smarter, faster decisions. He is passionate about translating complex data challenges into clear, actionable outcomes that drive meaningful growth for clients. Diego's collaborative leadership style and command of over 35 platforms and languages make him a cornerstone of Dynamic Data's ability to deliver cutting-edge AI and machine learning solutions across industries.

Analytics Engineer
Marcelo Bour is an Analytics Engineer at Dynamic Data and a certified dbt Developer, bringing a powerful combination of technical precision and business acumen to every project he undertakes. With a strong foundation in data modeling, workflow optimization, and analytics engineering, Marcelo plays a key role in streamlining data pipelines and reducing manual efforts for clients undergoing digital transformation. He is deeply committed to fostering collaboration across teams and aligning technical solutions with real business needs. Marcelo's ability to bridge the gap between complex data systems and practical business outcomes makes him an integral part of Dynamic Data's mission to help companies unlock the full value of their data.
A data visualization consultant helps organizations turn raw or complex data into dashboards, reports, and visual tools that are easier to understand and use. Their work typically includes selecting the right chart types, organizing KPIs, improving reporting workflows, and designing visuals for different audiences. The goal is to make insights clearer so teams can make faster, better-informed business decisions.
Talk with our team about dashboards, reporting, and BI strategy.

Validated expertise in dbt development.
100% Job Success Score
Growing consultancy with proven delivery.
Share your reporting goals, current challenges, and data environment. Our team will review your needs and outline the best next steps for a tailored visualization solution.
You can also send us a quick email at info@dynamicdata.agency.
You can also send us a quick email at info@dynamicdata.agency.