This article is for business leaders, analysts, and IT teams navigating Power BI for the first time or inheriting a deployment that isn't working. It covers what a real implementation involves, how data modeling drives performance, where organizations consistently go wrong, and what separates a high-utilization rollout from a platform that collects dust.
Key Takeaways
- Power BI implementation spans requirements, architecture, data modeling, governance, and user adoption — not just connecting data and building visuals.
- Data modeling is the structural foundation that determines whether reports are fast, accurate, and scalable.
- The star schema (one fact table connected to multiple dimension tables) is Microsoft's recommended design for most Power BI models.
- The most common failures: skipping planning, building dashboards before the data model is ready, and deferring governance.
- Done well, Power BI implementation cuts manual reporting effort, accelerates decisions, and builds a data foundation that scales.
What Power BI Implementation and Data Modeling Actually Involve
Power BI implementation is the structured process of deploying Microsoft Power BI across an organization — from connecting data sources and designing data models to publishing reports, establishing governance, and driving user adoption. It's not a single project event. It's a series of deliberate decisions that compound over time.
Data modeling is the architectural layer inside that process. It means organizing, relating, and structuring data tables so that calculations are accurate, reports load quickly, and the model can scale without requiring a complete rebuild. This is distinct from:
- Data visualization — the output (charts, dashboards, reports)
- Data transformation — the preparation step (cleaning and shaping raw data in Power Query)
The two are frequently mentioned together but understood separately. That gap matters. Weak data modeling is the primary reason dashboards run slowly and KPIs contradict each other — problems that surface only after a rollout is already underway. Skipping intentional data modeling doesn't save time; it creates rework that costs far more to fix later.
How the Power BI Implementation Process Works
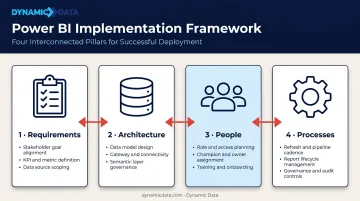
Successful Power BI implementations move through four interconnected pillars — Requirements, Architecture, People, and Processes — in defined project stages before any report reaches end users.
Step 1: Define Requirements and Business Objectives
This phase sets the direction for everything that follows. It involves:
- Identifying the 3–5 business problems Power BI will solve (slow reporting cycles, siloed data, inconsistent KPIs)
- Aligning stakeholders across finance, operations, and sales on must-have vs. nice-to-have capabilities
- Defining measurable success metrics — reduction in manual reporting time, dashboard adoption rates, time-to-decision improvements
Organizations that skip this step routinely build dashboards that get ignored — because the reports reflect what was easy to build, not what the business actually needed.
Step 2: Assess Data Infrastructure and Choose the Right Architecture
Before any modeling begins, the existing data landscape needs an honest audit:
- Inventory all data sources — ERPs, CRMs, cloud databases, flat files, APIs
- Evaluate data quality and volume — inconsistent formats and missing values at the source become structural problems in the model
- Choose a storage mode: Import (fastest performance, uses VertiPaq compression), DirectQuery (queries source at report time, no data import), or Composite (combines both)
Storage mode choice connects directly to licensing. Shared capacity supports up to 8 scheduled refreshes per day; Premium capacity supports up to 48 — a gap that shapes what the architecture can realistically deliver at scale.
Step 3: Design the Data Model and Build Reports
This is the most technically critical phase — and the one most organizations rush. The sequence matters:
- Design the schema (fact tables, dimension tables, relationships)
- Write and validate DAX measures
- Test the model against realistic data volumes
- Build dashboards only after the model is confirmed stable
Working with an implementation partner during this phase helps teams apply star schema conventions and pre-built DAX frameworks — catching structural decisions before they become expensive rebuilds once reports are live.
Step 4: Establish Governance, Security, and Rollout
Governance needs to be designed before users touch the platform, not retrofitted after launch:
- Row-level security (RLS) restricts data by role at the row level — note that RLS only applies to Viewer-role users, not Admins, Members, or Contributors
- Workspace organization by department or function, with a maximum of 1,000 semantic models per workspace
- Report certification (endorsement in Power BI) marks trusted datasets that have been reviewed by designated certifiers
- Refresh scheduling aligned to business needs and license tier
Rollout follows a phased Dev → Test → Production pipeline, with role-based training for executives, analysts, and front-line staff before full release.
Data Modeling in Power BI: The Architecture That Drives Results
Every Power BI data model is built from two fundamental table types:
- Fact tables — store transactional or event data (sales orders, inventory movements, user sessions). High volume, with foreign keys pointing to dimension tables.
- Dimension tables — provide context (customer names, product categories, dates, regions). Descriptive attributes with primary keys.
Microsoft defines fact tables as storing observations or events, while dimension tables describe the business entities involved. Get this distinction right and the rest of the model has a solid foundation.
Schema Design: Star Schema vs. Snowflake Schema
The star schema — one central fact table connected directly to multiple dimension tables — is Microsoft's recommended structure for Power BI semantic models. The reasons are practical:
- Fewer joins means faster query execution
- DAX calculations are simpler and more predictable
- Business users can navigate the model without needing to understand database normalization
- Performance tuning is more straightforward
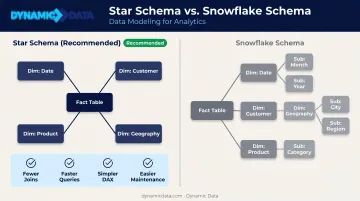
The snowflake schema normalizes dimension tables into sub-tables to reduce data redundancy. In a traditional data warehouse, that's reasonable. In Power BI specifically, it introduces more joins, slower report loads, and a model that's harder to maintain. Unless there's a compelling reason to denormalize dimensions, the star schema wins.
Relationships and Cardinality
Once your schema is set, how tables connect to each other determines how filters flow through the model. Power BI supports three relationship types:
| Relationship | When to Use |
|---|---|
| One-to-many | Default and preferred — one dimension record to many fact records |
| One-to-one | Rare; usually signals two tables that should be merged |
| Many-to-many | Use with caution — creates ambiguous filter paths; resolve with a bridge table |
Cross-filter direction should default to Single (dimension filters fact). Bidirectional filtering can negatively impact performance and should only be used when the use case is fully understood and documented.
Calculated Columns vs. Measures
Confusing these two has real consequences: wrong choices inflate model size, slow refresh times, and complicate DAX logic.
- Calculated columns — computed row-by-row at data refresh, stored in the model, consume memory. Use them for categorization, row-level logic, or slicer values.
- Measures — computed dynamically at query time based on filter context, stored only as formulas, zero impact on model size. Use them for aggregations, KPIs, and time intelligence.
The rule: use measures by default. Reach for calculated columns only when the use case specifically requires row-level storage. Over-reliance on calculated columns inflates model size and slows refresh times.
Key Factors That Affect Your Power BI Implementation
Data Quality at the Source
Gartner research estimates that poor data quality costs organizations at least $12.9 million per year on average. In a Power BI context, that cost shows up as excessive Power Query transformations, inflated model complexity, and reports that users stop trusting. The single most controllable implementation factor is addressing data quality issues at the source — before they become modeling problems.
Governance Timing
Governance decisions made early have compounding effects. Organizations that defer workspace structure, RLS design, and refresh scheduling until after rollout typically face a rebuild cycle within 12–18 months. When governance is retrofitted rather than built in, three problems emerge fast:
- Access conflicts from unplanned permission structures
- Data sprawl across unmanaged workspaces
- Audit failures that surface during compliance reviews
User Adoption
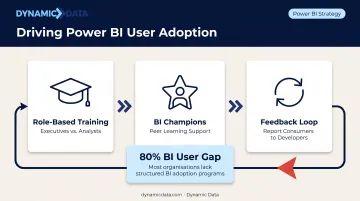
Forrester's research found that the "other 80%" of BI users still rely on a small group of analysts for data sourcing, KPI building, and insight delivery. Closing that gap takes deliberate investment in people, not just platform configuration:
- Role-based training (executives need different context than analysts)
- Internal "BI Champions" who support peer learning
- A structured feedback loop between report consumers and developers
The Microsoft Fabric adoption roadmap treats executive sponsorship, community of practice, and mentorship as distinct work streams — not afterthoughts. Organizations that invest in these areas before go-live consistently see higher report utilization and faster self-service adoption across teams.
Common Mistakes and Misconceptions in Power BI Implementation
The Flat Table Trap
Importing one large, denormalized table — the kind commonly found in Excel exports — instead of building a proper star schema is the single most common modeling mistake. The consequences are predictable:
- Slow refresh times as the model processes every column for every row
- Inflated file sizes that hit capacity limits faster
- Inaccurate calculations because DAX behaves unexpectedly with flat structures
- A model that can't scale without being rebuilt from scratch
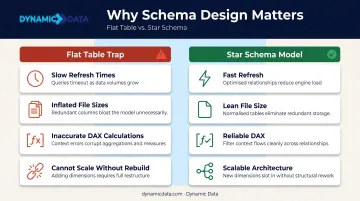
The misconception is that "all data in one place" means simplicity. In Power BI, it means the opposite.
Treating Deployment as the Finish Line
Many organizations set a go-live date as the end goal, then disengage. That's where value starts eroding. Power BI receives monthly feature updates, models need performance tuning, and DAX measures must evolve as business questions change. Many organizations set a go-live date as the end goal, then disengage. That's where value starts eroding. Post-deployment, three things demand ongoing attention:
- Monthly Power BI feature updates that may affect existing logic
- Performance tuning as data volumes and query complexity grow
- DAX measure revisions as business questions shift
Dynamic Data works with clients after go-live to iterate on models and extend reporting coverage into new business areas. A rollout that stops at deployment will underperform within a year.
Building Reports Before the Model Is Ready
Skipping directly to dashboards before the data model is validated creates an expensive rework cycle. Every visual built on an unstable model has to be rebuilt when requirements shift — and requirements always shift.
The architecture must be finalized, reviewed, and tested against realistic data volumes before the first production report is published. A structurally sound model is worth the extra weeks. A visually impressive dashboard built on shaky foundations will break in production.
Frequently Asked Questions
How is Power BI implemented?
Power BI implementation follows a structured process: define business requirements, design the data architecture and model, build and test reports, establish governance and security, train users, and deploy in phases. Ongoing monitoring and iteration after launch are essential — implementation doesn't end at go-live.
Is Power BI still in demand in 2026 and beyond?
Yes. Microsoft was named a Leader in both the 2025 Gartner Magic Quadrant for Analytics and Business Intelligence Platforms and the Forrester Wave for the same category, with 30 million monthly active users. Continued investment in Microsoft Fabric, Azure integration, and Copilot AI positions Power BI for strong long-term growth.
Is Power BI the same as SQL?
No. SQL is a query language used to retrieve and manipulate data in relational databases. Power BI is a business intelligence platform used to visualize and analyze data. They're frequently used together — SQL logic is applied at the data source level before data is loaded into Power BI.
What is the best data model structure for Power BI?
The star schema: a central fact table connected to multiple dimension tables. Microsoft recommends it for most Power BI implementations because it minimizes query complexity, improves performance, and delivers more reliable DAX results than flat or snowflake structures.
How long does a Power BI implementation typically take?
A focused pilot with one or two use cases often takes four to eight weeks. An enterprise-wide rollout covering multiple data sources, governance policies, and user training typically spans three to six months or more, depending on data complexity and organizational scope.
What is the difference between calculated columns and measures in Power BI?
Calculated columns are computed at data refresh and stored in the model, adding to file size. Measures are computed dynamically at query time and stored only as formulas. Measures are preferred for aggregations and KPIs because they keep the model lean and responsive.