Introduction
Poor financial visibility carries a measurable price tag. According to Gartner, poor data quality costs organizations an average of $12.9 million per year. And that figure doesn't account for the downstream consequences: budget overruns that nobody catches until the quarter closes, resources tied up in low-performing activities, and finance teams spending nearly half their working hours just collecting and validating data instead of acting on it.
That last point is telling. The 2024 FP&A Trends Survey found that FP&A teams spend 45% of their time on data collection and validation — and only 10% of organizations have access to real or near-real-time data updates. That's the real problem: by the time numbers reach leadership, they're already stale.
Costs in most organizations compound gradually — through fragmented systems, delayed reporting, and blind spots that go unaddressed because nobody has the data to see them. This article breaks down how Power BI analytics targets those compounding losses: from smarter pre-spend decisions to the governance structures that keep budgets from drifting off course.
Key Takeaways
- Without real-time visibility, operational costs compound quietly across departments until the budget damage is already done
- Power BI's core advantage is enabling faster, more accurate decisions before money is wasted, not just reporting what was spent
- The most impactful strategies span three areas: smarter spending decisions, leaner analytics workflows, and a well-governed Power BI environment
- Cost savings compound when Power BI is embedded into daily operations, not used as a quarterly reporting tool
- The strongest ROI comes from connecting Power BI to real cost data, governing it well, and scaling it across functions
How Business Costs Build Up Without Analytical Oversight
Most cost problems don't announce themselves. They accumulate through fragmented data, redundant processes, and manual workarounds that nobody questions — because nobody has a unified view of where spending actually goes.
The 2025 MuleSoft Connectivity Benchmark Report illustrates the scale: the average enterprise manages 897 applications, but only 29% are integrated. When data lives in that many disconnected places, costs get duplicated, misattributed, or simply missed.
Visible Costs vs. Hidden Costs
There's an important distinction between what finance teams typically track and what actually drives cost overruns:
Visible costs (what gets tracked):
- Headcount and compensation
- Direct procurement and vendor contracts
- Software licensing fees
Hidden costs (what gets missed):
- Manual rework hours from reconciling inconsistent reports
- Duplicate analytics tools serving overlapping purposes
- Delayed decisions caused by data gaps — and the cost of acting too late
Power BI is built to surface that second category. Traditional reporting misses hidden costs by design — those costs live in the gaps between systems, not inside any single one. That's exactly where disconnected data stacks let problems compound over time.
Why the Buildup Is Gradual
A missed anomaly in one month becomes a structural inefficiency by the next quarter. By the time it shows up in a financial review, the cost is already embedded in operations. Organizations relying on monthly or quarterly reporting cycles are almost always reacting to problems that started weeks earlier — and the pattern tends to repeat:
- Month 1: An anomaly appears in spend data but goes unflagged
- Quarter 2: The inefficiency becomes operational habit
- Financial review: The cost is already embedded — and harder to unwind
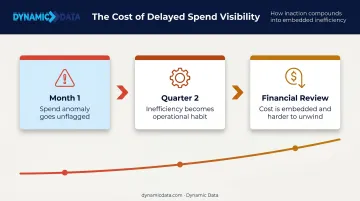
Real-time analytical oversight breaks this cycle before it completes.
Key Cost Drivers Power BI Analytics Can Expose
Cost drivers in most organizations are rarely where leadership assumes. They sit within process inefficiencies, vendor relationships, and workforce patterns — and they only become visible when you analyze data from multiple systems together.
Operational Fragmentation
When finance, procurement, HR, and operations each run from separate systems, costs get duplicated and misattributed. Power BI addresses this by acting as a single analytical layer across all those sources, connecting data that lived in separate systems.
The fragmentation problem extends to software spend. According to Flexera's 2024 State of ITAM Report, advanced ITAM practitioners estimate 20% of SaaS spend is wasted — and 53% of IT teams report challenges maintaining complete visibility into their technology investments.
Timing as a Cost Driver
Most organizations analyze costs after the fact. Corrective actions always lag behind the problem.
The FP&A Trends data reinforces this: 53% of organizations need more than five days to produce a forecast, and 63% cannot predict accurately beyond six months. The root cause is data timeliness, not forecasting capability. Power BI shifts cost management from hindsight-based reporting to continuous monitoring.
Scale Changes What's Relevant
Cost drivers behave differently depending on organizational stage:
- Growing companies: Unchecked SaaS and tool spend is the biggest risk — licenses accumulate faster than anyone tracks them
- Enterprises: Resource misallocation and process redundancy tend to dominate — the costs are larger but harder to see without cross-functional data
The right Power BI configuration surfaces the relevant drivers for each stage — which means how you build it matters as much as what you build it on.
Cost-Reduction Strategies with Power BI Analytics
Effective Power BI cost-reduction strategies aren't one-size-fits-all. The most impactful approach depends on where the opportunity is — in rethinking spending decisions, improving how analytics workflows operate, or changing how Power BI fits into the broader data environment.
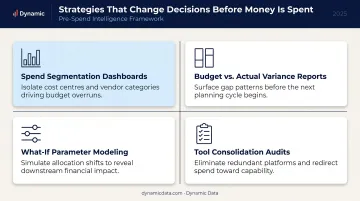
Strategies That Change Decisions Before Money Is Spent
Cost savings here come from informed choices, not reactive cuts.
Spend segmentation dashboards break down vendor, supplier, and category costs by volume and performance. This data supports contract renegotiations from a position of evidence instead of assumption — a meaningful advantage given that The Hackett Group found Digital World Class procurement organizations deliver nearly double the spend cost reduction savings of peers and generate 2.5x higher ROI.
Budget vs. actual variance reports surface overfunded cost centers before end-of-quarter reviews make reallocation impractical. Acting on variance data mid-period is fundamentally different from reviewing it after the budget cycle closes.
What-if parameter modeling lets finance and operations teams test the financial impact of headcount changes, pricing shifts, or outsourcing decisions before committing. Modeling assumptions before they become decisions removes one of the most expensive sources of organizational error.
Tool consolidation audits using Power BI's own usage data can identify redundant or underused subscriptions. Many organizations carry licenses for tools that overlap significantly with Power BI's native capabilities — surfacing this data makes consolidation a defensible, data-backed decision instead of a cost-cutting guess.
Strategies That Reduce the Cost of Running Analytics Itself
These approaches lower the labor and infrastructure cost of managing Power BI, not just the insights it produces.
Automated report distribution using Power BI's scheduled refresh and distribution features eliminates recurring manual work. FP&A teams spend 45% of their time on data collection and validation — automating even a portion of that workflow returns real capacity to analysis rather than assembly.
A Forrester Consulting study commissioned by Microsoft found that self-service Power BI use saved 125 hours per BI user per year and reduced centralized analytics team effort by 42%. For teams implementing reporting automation at scale, working with an experienced Power BI analytics partner like Dynamic Data can shorten deployment timelines and skip the trial-and-error that extends most rollouts.
Role-based dashboards with row-level security mean each team gets the cost views relevant to their function — without having to request custom reports from IT or analytics. This cuts the hidden labor cost of ad hoc data requests, which accumulates faster than most organizations track.
Automated alerts and anomaly detection on spend thresholds, budget consumption rates, or utilization drops flag cost issues automatically. Problems surface when they're still correctable, not when they appear in monthly reviews.
Centralized workspace governance eliminates the double-handling that happens when teams maintain separate dashboards or spreadsheet-based reports alongside Power BI. Parallel reporting systems create inconsistency, invisible maintenance costs, and reconciliation work that rarely gets measured but always gets paid.
Strategies That Change the Environment Around Power BI
In many cases, the surrounding setup — not the analysis — is the real cost driver.
Cross-system integration connects Power BI directly to ERP platforms, procurement tools, HR systems, and cloud infrastructure dashboards. Power BI supports connections to more than 100 data sources, including Dynamics 365, SAP HANA, Google BigQuery, Azure, and SQL Server. This cross-functional visibility reveals expenses that are invisible within any single system.
Proactive forecasting using Power BI's built-in time-series analysis and what-if parameters changes the cost conversation from damage control to planned intervention. Seasonal patterns and demand-driven cost fluctuations become manageable when teams see them coming instead of absorbing them after the fact.
Licensing right-sizing using Power BI's own usage metrics and activity logs identifies underutilized Premium capacity, inactive user licenses, and inefficient data refresh schedules. This is a frequently overlooked cost area — Power BI can audit its own usage, which most teams don't take advantage of.
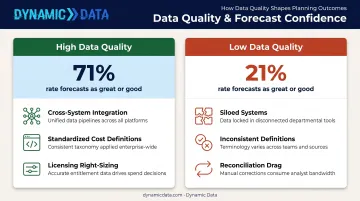
Data governance standardization removes the reconciliation drag caused by inconsistent cost definitions across teams. When two departments use different calculations for the same cost category, the result is conflicting reports, delayed decisions, and hidden reconciliation work.
A well-governed Power BI environment eliminates that overhead — and the accuracy improvement is measurable: organizations with high data quality are 71% more likely to rate their forecasts as great or good, compared to just 21% for low-data-quality organizations.
Conclusion
Power BI analytics creates cost savings by making the source of costs visible, traceable, and actionable. Arbitrary budget cuts tend to create new problems elsewhere. Reductions grounded in diagnostic data hold.
The organizations that capture the most value treat Power BI as an operational layer, not a reporting tool. Those that embed it into decisions, workflows, and governance structures build a compounding cost advantage: each quarter of better data narrows the gap between spending and outcomes.
Getting there faster, and with less internal trial and error, is where an experienced Power BI analytics partner makes a real difference. Dynamic Data works with mid-market and enterprise organizations to implement Power BI around specific cost reduction goals from day one — with defined milestones, not open-ended deployments that take quarters to produce anything actionable.
Frequently Asked Questions
How can Power BI analytics be used for expense and cost-benefit analysis?
Power BI connects to financial and operational data sources to build interactive expense dashboards. Its DAX calculation engine (250+ functions) lets teams calculate cost-benefit ratios, compare actuals against budgets, and analyze the return of specific decisions in real time.
What cost-saving strategies can Power BI analytics support?
Power BI supports savings across automated reporting, vendor spend analysis, budget variance tracking, predictive cost forecasting, and workforce productivity monitoring. Impact scales when these strategies are applied consistently across departments, not just within a single function.
What types of cost data can Power BI connect to and analyze?
Power BI connects to ERP systems, accounting platforms, procurement tools, HR and payroll systems, cloud usage dashboards, spreadsheets, and more — over 100 data sources in total. This enables a unified cost view that individual systems cannot provide on their own.
How does Power BI help identify hidden or indirect costs?
Power BI surfaces hidden costs by correlating data across systems, for example linking overtime patterns to scheduling gaps or cloud usage spikes to specific report refresh schedules. No single system's reporting can surface these connections on its own.
Can Power BI be used for budget forecasting and cost scenario planning?
Yes. Power BI includes native forecasting features for time-series data and supports what-if parameter modeling, allowing finance and operations teams to project future costs, test different spending scenarios, and align planning with realistic financial outcomes.
How long does it take to see cost savings after implementing Power BI analytics?
Quick wins like identifying redundant tools, flagging budget overruns, or cutting manual reporting hours are often visible within the first few weeks. Structural savings from forecasting and cross-functional integration typically follow within 1–3 quarters.