Custom Dashboards
Design and build interactive dashboards tailored to your KPIs, workflows, and stakeholders, making it easier to monitor performance, explore trends, and act on insights without digging through raw spreadsheets.
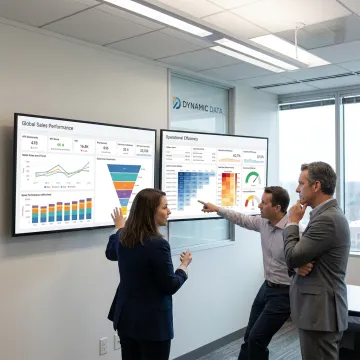
Turn complex datasets into intuitive dashboards, reports, and visual experiences that help teams spot trends faster and act with confidence. Dynamic Data designs custom interactive data visualization solutions that make KPIs easier to explore, explain, and share across technical and non-technical stakeholders, so your business can move from raw numbers to clear decisions.
Explore tailored visualization solutions that turn complex business data into clear, interactive, decision-ready insights.
Design and build interactive dashboards tailored to your KPIs, workflows, and stakeholders, making it easier to monitor performance, explore trends, and act on insights without digging through raw spreadsheets.
Implement live reporting environments that surface current metrics as they change, helping teams respond faster to operational shifts, campaign performance, and emerging opportunities with up-to-date visibility.
Create bespoke visualization tools that translate dense datasets into intuitive charts, graphs, and interfaces aligned to your business context, audience needs, and decision-making process.
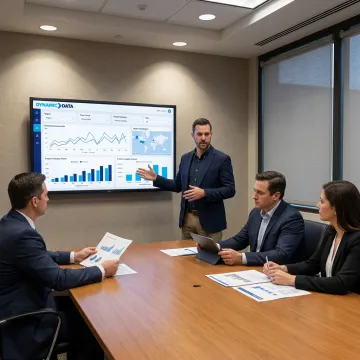
Develop business intelligence solutions that combine dashboards, reports, and visual analytics into a unified experience, giving leaders and teams a clearer view of performance across the organization.
Present data in a way that highlights meaning, context, and next steps, helping non-technical stakeholders understand what the numbers show and why they matter to the business.
Enable deeper analysis through interactive reports and drill-down views that let users investigate patterns, compare segments, and uncover insights hidden within large or complex datasets.
Custom interactive data visualization helps your team move beyond static reports and into faster, more confident decision-making. Dynamic Data creates dashboards, reporting environments, and visual tools tailored to your goals, users, and data sources. From executive overviews to detailed drill-down analysis, every solution is designed to make complex information easier to understand, share, and act on across your organization.
See how tailored visual analytics help organizations understand data and make smarter business decisions.
Businesses choose Dynamic Data for tailored solutions backed by technical depth and practical business insight.
Our team combines BI, analytics engineering, AI, and governance expertise for well-rounded visualization solutions.
We design dashboards and visual tools around your goals, users, and decision-making workflows.
Expertise across 35+ platforms and languages supports flexible integrations and scalable reporting environments.
Every engagement is shaped around practical outcomes, clearer reporting, and measurable business value.
Experienced specialists turning complex data into clarity.

CEO & Founder
Victoria Gallerano is the CEO and Founder of Dynamic Data, which she established in 2020 with a mission to transform complex data into actionable insights for businesses worldwide. A recognized expert in Business Intelligence, Artificial Intelligence, and Data Governance, Victoria founded the company to help organizations launch modern data stacks, automate reporting, and harness the power of machine learning for real, measurable results. Under her leadership, Dynamic Data has grown to a team of over 40 professionals spanning Europe, South America, and the USA. Victoria is driven by a client-centric mindset and a passion for innovation, ensuring every solution delivered is tailored to help businesses thrive in an increasingly digital world.

CTO
Diego Prinzi serves as Chief Technology Officer at Dynamic Data, where he leads a multidisciplinary team of data professionals dedicated to delivering innovative, client-driven solutions. With over 15 years of experience in software development and data engineering, Diego brings deep technical expertise and a strategic vision that empowers businesses to make smarter, faster decisions. He is passionate about translating complex data challenges into clear, actionable outcomes that drive meaningful growth for clients. Diego's collaborative leadership style and command of over 35 platforms and languages make him a cornerstone of Dynamic Data's ability to deliver cutting-edge AI and machine learning solutions across industries.

Analytics Engineer
Marcelo Bour is an Analytics Engineer at Dynamic Data and a certified dbt Developer, bringing a powerful combination of technical precision and business acumen to every project he undertakes. With a strong foundation in data modeling, workflow optimization, and analytics engineering, Marcelo plays a key role in streamlining data pipelines and reducing manual efforts for clients undergoing digital transformation. He is deeply committed to fostering collaboration across teams and aligning technical solutions with real business needs. Marcelo's ability to bridge the gap between complex data systems and practical business outcomes makes him an integral part of Dynamic Data's mission to help companies unlock the full value of their data.
Custom interactive data visualization services involve designing dashboards, reports, and visual tools tailored to your business goals, users, and data sources. Instead of relying on generic templates, these solutions are built around your KPIs and workflows, allowing users to filter, drill down, compare segments, and explore trends in a way that supports faster, more informed decisions.
Talk with our team about your dashboards, data, and reporting goals.

Validated expertise in dbt development.
100% Job Success Score
Tailored solutions built around outcomes.
Share your goals, data challenges, and reporting needs. We’ll help you explore the right visualization approach for your business.
You can also send us a quick email at info@dynamicdata.agency.
You can also send us a quick email at info@dynamicdata.agency.