Introduction
Financial institutions generate enormous volumes of data every day — transaction records, customer interactions, credit assessments, regulatory filings, market feeds. Yet for many organizations, the gap between data collected and decisions actually made remains frustratingly wide.
Much of this data sits in silos. Reports arrive days after the fact. Risk signals surface too late to act on. Deloitte's 2024 banking data survey found that 94% of senior US banking personnel name data quality and availability as a top priority — which tells you just how far most institutions still have to go.
Business intelligence (BI) closes this gap. It converts scattered operational data into structured, timely insight that decision-makers can actually use. What follows covers the core use cases, what a practical BI strategy looks like, and where AI is taking financial analytics next.
Key Takeaways
- Data silos, manual reporting, and delayed insights remain common in financial institutions — BI tackles all three at the source
- High-impact use cases include fraud detection, customer personalization, credit risk modeling, and compliance automation
- Start with a data audit before selecting any BI tool — strategy comes first
- Power BI, Tableau, and Looker are widely used; the right choice depends on integration needs and real-time requirements
- AI and machine learning are shifting financial BI from describing the past to predicting and shaping what happens next
What Is Business Intelligence in Financial Services?
Business intelligence in financial services is the practice of collecting, integrating, and analyzing data from across an organization — transactions, customer records, market feeds, operational logs — to produce insights that inform both strategic and day-to-day decisions.
This is fundamentally different from traditional financial reporting. Reporting tells you what happened last quarter in a standardized format. BI lets you explore why it happened, compare trends across segments, and model what might happen next — dynamically, across any data source.
That distinction matters because financial services isn't a monolithic industry. Each segment produces different data, asks different questions, and faces different pressures — which shapes how BI gets applied in practice.
Scope Across the Industry
BI applies across the full spectrum of financial services:
- Banking — deposit behavior, credit exposure, branch performance
- Insurance — claims patterns, underwriting risk, customer lifetime value
- Wealth management — portfolio analytics, client segmentation, advisor productivity
- Investment banking — deal pipeline, market exposure, counterparty risk
- Lending — origination funnel, default modeling, portfolio concentration
The data environments differ significantly, but the core problem is consistent: decisions are being made on incomplete or delayed information, and BI closes that gap.
The Four Analytical Layers
Most organizations start at the descriptive layer and mature upward over time:
| Layer | Question Answered | Example |
|---|---|---|
| Descriptive | What happened? | Monthly default rates by product |
| Diagnostic | Why did it happen? | Why Q3 defaults rose in one region |
| Predictive | What will likely happen? | Which customers are likely to default |
| Prescriptive | What action should we take? | Recommended credit limit adjustments |
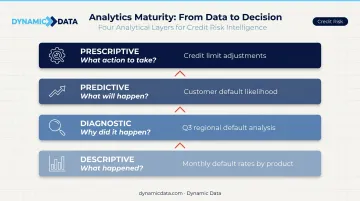
Most financial institutions have solved the descriptive layer. The real competitive gap is at the predictive and prescriptive levels — where BI doesn't just report outcomes but actively informs what to do before a problem surfaces.
Why Financial Services Organizations Need BI Now
Legacy Systems Are Failing Risk Teams
The fragmentation problem is well-documented. The Basel Committee on Banking Supervision assessed 31 global systemically important banks in 2022 and found that only 2 were fully compliant with all BCBS 239 Principles for risk data aggregation. The ECB's 2024 supervisory guide flagged cases where monthly risk reports took 40 or more working days due to reconciliation errors and manual adjustments.
That's not a reporting delay — it's a material risk exposure.
Regulatory Pressure Is Intensifying
AML, KYC, GDPR, and regional equivalents all require financial institutions to monitor, document, and report on data with increasing precision. Manual compliance workflows create two compounding problems:
- Human error — inconsistent data handling across systems introduces reconciliation gaps that regulators flag
- Slow response times — manual processes can't keep pace with real-time threshold monitoring or on-demand audit requests
Automated BI monitoring addresses both — generating audit trails, flagging threshold breaches in real time, and reducing the manual effort involved in periodic reporting. KPMG estimates institutions can save an average of 25% of annual compliance costs through automation.
The Competitive and Market Pressure
Digital-first competitors and fintech challengers are building data infrastructure that legacy institutions can't match through manual processes alone. The financial analytics market is valued at $12.49 billion in 2025 and projected to reach $23.42 billion by 2031 — an 11% CAGR that reflects how aggressively the industry is investing in this capability.
That investment is partly driven by customers who now expect more. Modern banking customers want personalized product recommendations, proactive outreach, and fast responses. BI enables institutions to analyze behavioral data, transaction history, and life events to deliver that relevance across millions of accounts — and to identify at-risk customers before they churn.
Key Use Cases of Business Intelligence in Financial Services
BI has broad applicability in financial services, but five use cases consistently deliver the most measurable impact.
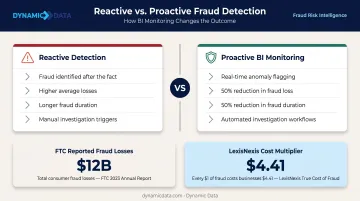
Fraud Detection and Prevention
BI systems analyze transaction data continuously, comparing current activity against established behavioral baselines to flag anomalies — unusual transaction sizes, atypical locations, irregular frequencies. When something deviates from pattern, investigation workflows trigger automatically.
The financial stakes make this critical. The FTC reported that consumers lost over $12 billion to fraud in 2024, and LexisNexis Risk Solutions found that every $1 lost to fraud costs North American financial institutions $4.41 after accounting for fines, fees, and investigative effort.
The shift from reactive to proactive detection matters enormously. ACFE's 2024 Report to the Nations found that organizations using proactive data monitoring experienced a 50% reduction in both fraud loss and duration compared to those relying on reactive detection.
Customer Personalization and Retention
BI aggregates customer data — spending habits, product usage, life stage, interaction history — to build profiles that let institutions anticipate needs and present timely offers.
Consider a practical example: a customer's transaction data shows they've begun making large home improvement purchases and recently paid off an auto loan. A BI-enabled institution can surface a home equity product offer at exactly the right moment — not six months later after a generic campaign.
The impact on engagement is concrete. J.D. Power found that 47% of customers who received effective advice opened a new account. When customers receive tailored fee guidance, overall satisfaction scores jump 166 points on a 1,000-point scale.
Risk Management and Credit Scoring
Those customer-facing gains only matter if the institution is lending and operating sustainably. That's where BI's impact on risk management becomes equally important.
Modern BI moves well beyond static credit scoring models. By integrating real-time market data, behavioral signals, and macroeconomic indicators, institutions can build dynamic credit risk models that adapt as conditions change. For lending teams, this means:
- Identifying creditworthy borrowers that outdated scoring logic would decline
- Monitoring portfolio-level exposure against live macroeconomic signals
- Balancing default probability against account-level profitability in real time
Regulatory Compliance Automation
BI automates the collection, analysis, and reporting of compliance-related data. Regulatory thresholds — AML transaction limits, KYC review triggers, suspicious activity indicators — can be monitored continuously rather than reviewed in periodic manual batches.
This reduces both cost and exposure. Automated reporting also produces cleaner audit trails than manual processes, which gives institutions a defensible, timestamped record when regulators request documentation.
Operational Efficiency
BI identifies internal process bottlenecks that standard reporting misses: slow service resolution times, underperforming branches, redundant manual workflows, products with deteriorating unit economics.
When routine report generation runs automatically, analyst time shifts from pulling and formatting data to interpreting it — cutting report production cycles from days to hours and surfacing findings while they're still actionable.
Benefits of BI for Financial Organizations
The returns from BI investment show up across multiple dimensions:
Faster, better decisions — Real-time dashboards give CFOs, product managers, and risk leads a current view of the KPIs that matter, rather than waiting for weekly or monthly report cycles. When conditions change, decision-makers can respond within hours instead of days.
Reduced cost of poor data quality — Gartner research puts the average cost of poor data quality at $12.9 million per year. Automated data pipelines and quality checks eliminate the manual reconciliation, correction cycles, and downstream errors that drive this cost.
Operational productivity — Bain & Company's 2024 financial services survey found that generative AI delivers an average 20% productivity gain across use cases. Even without AI augmentation, automating routine reporting frees substantial analyst capacity for higher-value work.
Proactive risk and compliance coverage rounds out the picture. Real-time monitoring across credit, market, and operational risk dimensions reduces both financial exposure and regulatory penalties simultaneously — without requiring separate tooling for each risk type.
Getting these benefits in practice comes down to having the right data foundation in place. Dynamic Data works with financial organizations to build that foundation: automated ETL/ELT pipelines, governed data warehouses, and audit-ready data architectures on platforms like Snowflake, BigQuery, and Databricks.
How to Build a BI Strategy for Financial Services
Start With a Data Landscape Audit
Before selecting tools, map what you have. Which departments produce data? Where does it live? Are systems integrated or siloed? What metrics are currently tracked, and which decisions do they actually inform?
This assessment reveals two things: where the biggest gaps are, and where quick wins exist. Investing in tools before completing this step is one of the most common — and expensive — mistakes financial institutions make.
Define Goals, KPIs, and a Roadmap
BI strategy must connect to business objectives. Reducing credit defaults, improving customer retention, and accelerating regulatory reporting all require different data models, metrics, and dashboards.
Distinguish between:
- KPIs — metrics tied to performance targets that drive action
- Tracked metrics — monitored for context but not performance-linked
- Untracked metrics — available in the data but not yet surfaced
A written vision document that finance, IT, compliance, and product teams can all align on is worth the effort. Without it, BI projects drift toward serving whichever team applies the most pressure.
Build a Strong Data Governance Foundation
BI is only as reliable as the data feeding it. Without governance, different teams produce conflicting outputs from the same underlying data — and once that happens, trust in the BI system erodes quickly.
Key governance elements for financial organizations:
- Data ownership — designated owners for each critical data domain
- Metric definitions — business-approved definitions that prevent conflicting calculations
- Data quality checks — automated validation that catches errors before they reach dashboards
- Data lineage — documented tracking of where data originates and how it transforms
This is where partnering with a team that understands both data engineering and financial data complexity makes a measurable difference. Dynamic Data builds these governance frameworks — including ISTQB-certified quality assurance across data pipelines — to meet the standards financial environments demand.
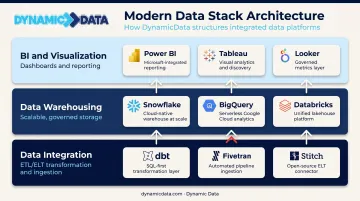
Choose the Right Tools and Data Stack
With governance in place, technology selection becomes a clearer decision. Financial BI implementations typically span three layers:
- Data integration — ETL/ELT tools (dbt is widely used for transformation; Fivetran and Stitch for ingestion)
- Data warehousing — Snowflake, BigQuery, and Databricks are common choices, each with different strengths in scalability, real-time processing, and cost structure
- BI/visualization — Power BI, Tableau, and Looker are the most widely deployed in financial services
When evaluating BI platforms, prioritize:
- Real-time data refresh capabilities for risk and fraud use cases
- Role-based access controls that enforce data security and compliance
- Integration with existing core banking, CRM, and ERP systems
No single platform fits every institution — the right choice depends on team size, existing infrastructure, and whether real-time querying is a hard requirement.
Train, Adopt, and Continuously Refine
Technology alone doesn't deliver BI value. The most common failure mode is a technically sound implementation that nobody uses because the outputs don't match how business users actually make decisions.
Practical steps to drive adoption:
- Identify executive sponsors who will use — and visibly rely on — BI outputs
- Train cross-functional teams, not just the data team
- Create a feedback loop between business users and BI developers so dashboards evolve with the business
- Revisit metrics and data models quarterly — what mattered 12 months ago may not be what matters now
The institutions that get the most from BI treat it as a living system — one that adapts as the business, the regulatory environment, and the data landscape change.
The Future: AI, Machine Learning, and Next-Gen Financial BI
From Descriptive to Predictive — at Scale
Machine learning is extending BI from reporting what happened into predicting what will happen next. Models can identify patterns across datasets that would be invisible to human analysts — flagging credit risk signals weeks before default, detecting early fraud indicators across millions of daily transactions, identifying customers likely to churn, or catching liquidity stress patterns before they escalate.
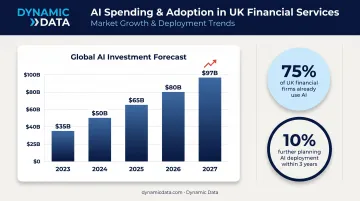
Financial sector AI spending is projected to rise from $35 billion in 2023 to $97 billion in 2027, according to BIS Financial Stability Institute analysis. The Bank of England and FCA found that 75% of UK financial firms already use AI, with a further 10% planning deployment within three years.
Real-Time Analytics as a Competitive Requirement
As financial institutions migrate to cloud infrastructure, real-time analytics becomes achievable at enterprise scale. Deloitte's 2024 survey found that 52% of banking and capital markets organizations have already migrated more than half of their data to the cloud — creating the foundation for intraday risk monitoring, real-time fraud prevention, and dynamic pricing that batch-based systems cannot support.
Cloud-deployed financial analytics is growing at a 13.04% CAGR through 2031, outpacing on-premise alternatives.
Natural Language Interfaces Democratize Access
Increasingly, the bottleneck in financial BI isn't the data — it's access. Natural language query interfaces let business users ask questions in plain English and get immediate answers, without routing every request through a data analyst.
This matters across the org chart. A compliance officer can query transaction patterns. A relationship manager can pull client risk exposure. A portfolio analyst can test a thesis against historical data. None of them need to wait for a ticket to be fulfilled.
Dynamic Data builds these capabilities for financial services clients — combining natural language interfaces with anomaly detection and predictive modeling to put analytics in the hands of the people making day-to-day decisions.
Frequently Asked Questions
What is the difference between business intelligence and financial reporting?
Traditional financial reporting describes historical results in standardized formats : what happened last quarter, last year. BI enables dynamic, multi-dimensional analysis across data sources, allowing users to explore trends, diagnose causes, and model future scenarios — not just view a static snapshot.
How does BI help with regulatory compliance in financial services?
BI automates compliance data collection and reporting, monitors regulatory triggers like AML thresholds and KYC requirements in real time, and generates audit trails automatically. This reduces manual effort, minimizes human error, and lowers the risk of delayed regulatory responses.
What are the biggest challenges of implementing BI in banking and finance?
The three most common barriers are data silos and poor data quality, legacy system integration complexity, and low user adoption. Each is addressable with the right governance framework, integration architecture, and change management approach. All three typically need attention at once.
Which BI tools are most commonly used in financial services?
Power BI, Tableau, and Looker are the most widely deployed. The right choice depends on integration needs, team size, real-time data requirements, and compliance considerations. No single platform fits every institution.
How long does it take to implement a BI solution for a financial institution?
Timelines vary based on scope and legacy infrastructure. Simple dashboard rollouts can take weeks; full modern data stack implementations typically run several months, and a phased approach that delivers early wins helps sustain adoption throughout.
How does AI improve business intelligence in financial services?
AI shifts BI from describing past performance to predicting future outcomes, supporting fraud detection, credit risk modeling, churn prediction, and natural language querying. Machine learning models improve continuously as more data flows through, so insights sharpen over time rather than remaining fixed.