This guide walks through the full Power BI implementation process: from defining business objectives and assessing data readiness, to deployment, governance, and scaling. It's written for both business and technical stakeholders who need a clear picture of what a successful rollout actually involves.
By the end, you'll know how to approach the process strategically, where most implementations go wrong, and when it makes sense to bring in outside expertise.
TL;DR: Key Takeaways
- Power BI implementation spans data connections, model building, security, and training — not just report creation
- A structured plan covering KPIs, data readiness, licensing, and governance prevents costly rework
- BI adoption has been stuck at roughly 20% for years — user involvement and role-specific design are the fix
- Governance and Row-Level Security must be configured before deployment, not retrofitted
- Small teams with existing BI skills can self-implement; complex environments benefit from outside expertise
What Is Power BI Implementation?
Power BI implementation is the end-to-end process of deploying Microsoft Power BI within an organization. It covers connecting data sources, building semantic models, designing dashboards, configuring security, training users, and establishing governance — not just installing software or running a few ad-hoc reports.
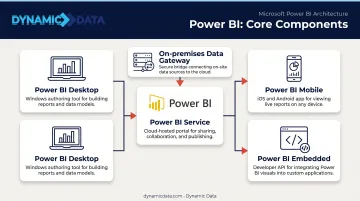
A complete Power BI environment has five core components:
- Power BI Desktop — Windows application for building reports and data models before publishing
- Power BI Service — Cloud platform for publishing, sharing, and managing content
- On-premises data gateway — Connects cloud services to on-premises data without moving it
- Power BI Mobile — Enables access to reports on phones and tablets
- Power BI Embedded — For organizations embedding analytics into external-facing applications
Having the right tools in place is table stakes. How they're configured around your specific data, workflows, and users is what determines whether the rollout sticks. Gartner predicts that 80% of data and analytics governance initiatives will fail by 2027 due to lack of executive urgency and clear ownership — a pattern that shows up repeatedly in Power BI rollouts that skip the planning fundamentals.
Key Components of a Power BI Implementation Plan
The plan is the strategy document you build before touching the tool. Skip it and you're making architectural decisions reactively — which is how dashboards end up rebuilt three months after launch.
Five Non-Negotiable Plan Components
- Defined business objectives and KPIs — Every dashboard should trace back to a strategic goal
- Data readiness assessment — Audit all sources for quality, completeness, and lineage before development
- Licensing and deployment architecture — Match the license tier to your user count, dataset size, and sharing requirements
- Governance and security framework — Access control, ownership, and naming conventions defined upfront
- User adoption and training strategy — Role-specific onboarding, not a single all-hands demo
Business Objectives First
The most common planning mistake is jumping to dashboard design without mapping goals first. The right sequence:
- Start with a strategic outcome (for example, revenue growth by region)
- Identify the KPIs that measure it (sales per territory, deal close rate)
- Build the visuals that surface those metrics
Focusing on 3–5 KPIs beats trying to surface everything at once. Teams that skip this step routinely find themselves rebuilding dashboards — or watching them go unused.
Data Readiness Assessment
With objectives and KPIs defined, the next question is whether your data can actually support them. Audit every source — ERPs, CRMs, spreadsheets, databases — for completeness, accuracy, and consistency before development begins. Map data lineage so you understand where each metric originates and what transformations it goes through.
The cost of skipping this step is real. Gartner estimates poor data quality costs organizations at least $12.9M per year on average. Data quality issues discovered mid-build don't just add delay — they often require scrapping and restarting model work.
Licensing Decisions
Choosing the right license early prevents costly migrations later. Match the tier to your user count, dataset size, and sharing requirements:
| License Tier | Best For |
|---|---|
| Power BI Pro ($14/user/month) | Team collaboration and report sharing |
| Premium Per User ($24/user/month) | Large datasets and advanced features |
| Premium Per Capacity (legacy P-SKUs) | Enterprise scale — note: P-SKUs removed for new customers July 2024 |
| Power BI Embedded | Customer-facing or app-embedded analytics |
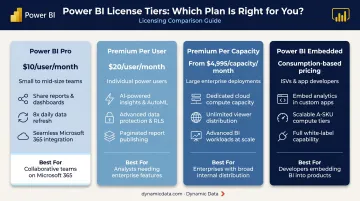
Always verify current pricing directly on Microsoft's Power BI pricing page — tiers and costs change.
Step-by-Step Power BI Implementation Phases
A phased approach reduces rework and keeps the rollout repeatable. These phases are iterative, not purely sequential — expect to revisit earlier decisions as requirements sharpen.
Phase 1–2: Planning and Data Assessment
Phase 1 — Define Business Objectives
Work with executives, finance, and operations to map strategic goals to measurable KPIs. Categorize them:
- Strategic — board-level metrics (revenue, market share)
- Tactical — team-level performance indicators (pipeline conversion, headcount efficiency)
- Operational — day-to-day process metrics (order fulfillment time, ticket resolution)
Pick the top 3–5 that have the highest decision impact and build toward those first.
Phase 2 — Assess Data Readiness
Catalog all data sources. For each, evaluate:
- Completeness — are there missing fields or records?
- Accuracy — does the data match the source of truth?
- Consistency — are definitions standardized across systems?
Document data lineage and identify integration gaps. This phase sets the realistic scope and timeline for everything that follows.
Phase 3–5: Design and Build
Phase 3 — Requirements and User Personas
Run workshops with each key user group — executives need summary views, analysts need drill-down capability, operations teams need refresh frequency that matches how they work. Document preferred formats, filter requirements, and data freshness expectations.
User personas translate those differences into concrete design decisions, so each group gets a report built for how they actually work — not a compromise that serves none of them well.
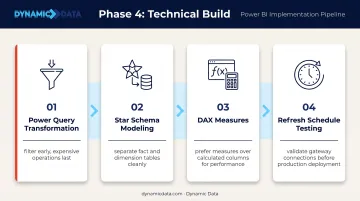
Phase 4 — Build Data Models and Integrations
The technical build phase covers:
- Cleaning and transforming data in Power Query (filter early, do expensive operations last)
- Building relationships using star schema — Microsoft recommends this specifically for Power BI performance and usability
- Writing standardized DAX measures with consistent naming
- Testing refresh schedules end-to-end
Document the data model logic thoroughly. When requirements change six months later, that documentation is what keeps the rebuild fast and the logic sound.
Phase 5 — Design Dashboards and Reports
Map each KPI to an appropriate visual type based on the data's nature:
- Time-based trends → line charts
- Comparisons across categories → bar or column charts
- Part-to-whole relationships → donut or treemap
Once visuals are mapped, apply these layout principles across every report:
- Executive summary pages should answer key questions at a glance
- Analyst views can have more depth, with drillthrough and slicers
- Limit visuals per page — Microsoft's optimization guidance explicitly recommends this to improve rendering performance
- Maintain a consistent visual style across all reports
Phase 6–8: Testing, Deployment, and Ongoing Use
Phase 6–7 — Test, Validate, and Optimize
Validate every number against the source system before publishing. Then stress-test:
- Refresh cycles under load
- Concurrent user access
- DAX query performance on large datasets
Conduct User Acceptance Testing (UAT) with actual end-users, not just the implementation team. Start validation with your highest-impact KPI dashboards.
Phase 8 — Deploy, Train, and Monitor
Roll out to a pilot group before full deployment. For training:
- Deliver role-specific sessions, not generic walkthroughs
- Provide written documentation and short reference guides
- Track adoption metrics and report usage logs from day one
Post-deployment monitoring tells you which reports drive decisions and which get ignored — that signal directs where iteration effort is worth spending.
Data Governance, Security, and Access Control
Governance configured after deployment creates problems that are expensive to unwind: inconsistent data ownership, compliance exposure, and users who stop trusting the numbers. Build it before you publish anything.
Workspace Roles
Microsoft defines four workspace roles in the Power BI Service:
| Role | What They Can Do |
|---|---|
| Admin | Full control — manage access, settings, and all content |
| Member | Manage apps and content, fewer rights than Admin |
| Contributor | Create, edit, and delete content; limited permission management |
| Viewer | View and interact with content only |
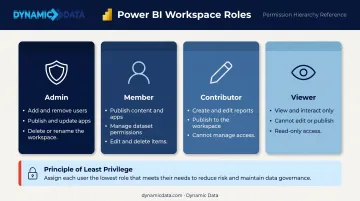
Assign roles using the principle of least privilege — users get access to what they need, nothing more.
Row-Level Security (RLS)
RLS filters data at the row level based on user identity. A regional sales manager sees only their territory's data within the same report that the VP sees in full. This is configured in the data model and must be tested before any report is published.
Both static and dynamic RLS patterns exist. Dynamic RLS scales better for large organizations — it uses a user table to determine access rather than hardcoded role rules.
Governance Framework Components
A functional governance framework covers:
- Defined content ownership for every report and dataset
- Version control processes so changes can be tracked and rolled back
- Naming conventions applied consistently across workspaces, datasets, and measures
- A Center of Excellence (COE) to own platform standards, certify datasets, and enforce self-service guardrails
For organizations scaling Power BI across departments, a COE prevents report sprawl before it starts. Without one, ownership gaps and inconsistent standards compound quickly across teams. Dynamic Data includes governance framework setup as a core deliverable in its implementation engagements — covering ownership documentation, access control design, and the standards that keep the environment scalable from day one.
Common Power BI Implementation Challenges
Poor Data Quality
Inaccurate dashboards almost always trace back to the data itself, not the tool. A compressed or skipped data assessment phase is the usual culprit. Establish data validation rules and automated quality checks before connecting any source to Power BI.
Low User Adoption
Average BI adoption has been stuck around 20% for years, according to BARC and Eckerson Group's survey of 214 companies. The reason dashboards go unused is rarely technical — it's that they don't match how teams actually work.
Closing that gap comes down to three things:
- Include end-users in requirements workshops, not just IT and management
- Design role-specific views instead of one-size-fits-all reports
- Deliver hands-on training tied to real workflows
Performance and Complexity
Slow dashboards and confused users share a common cause: too much in one place. Oversized data models and page-heavy reports create both problems at once.
A few targeted changes make a significant difference:
- Load pre-summarized data instead of raw transactional tables — Microsoft's primary recommendation for reducing Import model size
- Remove columns not referenced in any report
- Limit visuals per page and apply Top N filters where appropriate
Should You Work with a Power BI Implementation Partner?
Self-implementation works when you have a small team, a straightforward use case, and existing BI expertise already in-house. It's a reasonable path for organizations that have done this before.
A partner becomes the better option when:
- The organization lacks internal BI or data engineering skills
- Data spans multiple complex systems (ERP, CRM, cloud warehouses, on-premises databases)
- Speed matters and prolonged time-to-value carries real business cost
- Governance and security requirements are non-trivial
What to Look for in a Partner
Once you've decided a partner makes sense, the selection criteria matter just as much as the decision itself. Not all implementation partners operate at the same depth. Look for:
- Hands-on experience across the full lifecycle — not just dashboard design
- A structured methodology with defined phases and clear deliverables
- Capability in data engineering and governance, not just visualization
Dynamic Data's team covers BI, data engineering, and governance, helping organizations build a modern data stack alongside their Power BI environment. Dashboards are only as reliable as the data feeding them. A clean, governed, scalable stack is what makes Power BI actually perform at the level organizations expect.
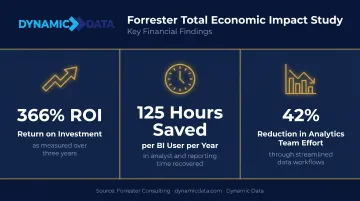
The Business Case for Partner Support
Forrester Consulting's commissioned Total Economic Impact study on Power BI reported a 366% three-year ROI, 125 hours saved per BI user per year, and a 42% reduction in centralized analytics team effort. That's a platform-level business case, not a direct partner comparison — but it shows exactly what's at stake when implementation is executed well versus cobbled together under time pressure.
The strongest argument for bringing in a partner is risk reduction and immediate capability access. For organizations without deep BI or data engineering expertise in-house, getting implementation right from the start is worth more than any projected cost savings on a spreadsheet.
Frequently Asked Questions
What is Power BI implementation?
Power BI implementation covers the full deployment lifecycle — connecting data sources, modeling data, designing dashboards, configuring security, and training users. The goal is making insights accessible and actionable across the business, not just getting the reports to render.
What are the key components of a Power BI implementation plan?
A complete plan covers five areas: defined business objectives and KPIs, a data readiness assessment, a licensing and deployment decision, a governance and security framework, and a user adoption and training strategy. Skipping any of these typically creates rework later.
Can I use Power BI for planning?
Yes. Power BI supports financial and operational planning by connecting to planning data sources and visualizing forecasts against actuals. It also integrates with Excel and Microsoft Fabric for scenario modeling.
How long does a Power BI implementation take?
A basic implementation for a small team typically runs 4–8 weeks. Enterprise rollouts involving multiple data sources, governance frameworks, and training programs commonly take 3–6 months or longer, depending on data complexity and organizational readiness.
What are the biggest challenges in Power BI implementation?
Poor data quality, low user adoption, and overly complex dashboards are the most common failure points. Each is preventable — structured planning catches data issues early, involving users from the start drives adoption, and phased deployment keeps dashboards manageable.
Do I need a partner to implement Power BI?
Small teams with existing BI skills can handle straightforward implementations independently. Organizations with complex data environments, limited internal capability, or tight timelines typically benefit from a partner's methodology and technical depth — both help avoid the rework that derails most in-house efforts.