
Stop Taking Polaroids: Why Your CRM Pipeline Needs a Movie Camera
Most Sales Managers live in a world of "Right Now." They open their CRM dashboard and see a $5M pipeline, a 20% win rate, and a list of deals set to close by month-end.
But there is a ghost in the machine: Context. Was that $5M pipeline $6M last Monday? If a deal just shrank from $100k to $50k, does your reporting even surface the loss, or does it just quietly update the total?
The reality is that most CRMs suffer from "Data Amnesia"—they are excellent at showing you the current state, but terrible at remembering how you got there. Let’s explore how to fix this missing middle and transform your sales data from static snapshots into high-fidelity trend analytics.
The Problem: The "Current State" Illusion
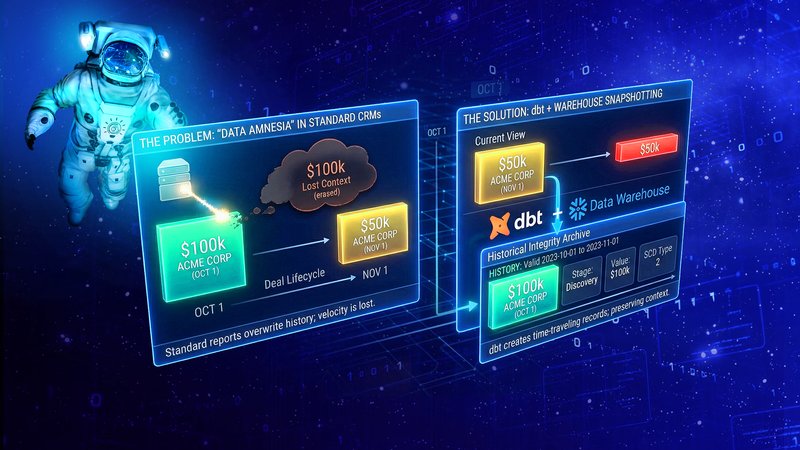
Standard CRM reporting (like Salesforce or HubSpot) is excellent at telling you what is in the pipe today. However, it is notoriously bad at historical reconstruction.
Think of it as the "Data Amnesia" challenge. If an opportunity was $100k last week and is $50k today, the CRM simply shows $50k. The “memory” of that $100k is buried deep within the system. While native CRM features like Salesforce's Field History Tracking provide a basic audit log for individual record changes, these data structures quickly reveal their limitations when you attempt to extract and aggregate them into comprehensive, pipeline-wide historical reports.
Without historical snapshots, you can't answer critical questions:
- Pipeline Velocity: How fast are deals actually moving?
- The "Push" Factor: How many times has the "Close Date" been kicked down the road?
- Inventory Flow: Did our pipeline grow because we opened new deals, or because old deals are just sitting there?
The Solution: Snapshotting with the Modern Data Stack
To get these answers and truly understand your sales velocity and forecast accuracy, you have to stop looking at static snapshots and start capturing the trend. You need to move from "State-based" reporting to "Time-series" reporting.
By leveraging the Modern Data Stack, you can finally move from guessing why your pipeline shifted to seeing exactly where the value is leaking. This requires two main architectural components:
- The Data Warehouse (The Library)
Whether it’s Microsoft Fabric, Snowflake, BigQuery, or Databricks, the warehouse acts as your permanent record. Instead of overwriting data, you are appending it. Every day (or week), you capture the state of every single opportunity.
2. dbt (The Historian)
dbt (Data Build Tool) is the engine that makes this manageable. Specifically, dbt has a feature called Snapshots. Most business users understand the concept of a bank statement—dbt brings that same level of accountability to CRM data.
How it works: dbt tracks changes in your source tables. If a record changes (e.g., a Stage moves from "Discovery" to "Proposal"), dbt records the previous state, the new state, and the timestamp of that change. Instead of overwriting the old data, dbt "retires" the yesterday version by adding a timestamp (e.g., valid_to: 2023-10-26) and creates a brand new row for today (valid_from: 2023-10-27).
The Result: You end up with a Type 2 Slowly Changing Dimension (SCD) table. This allows you to "time travel" and see exactly what the pipeline looked like on any specific date in history.
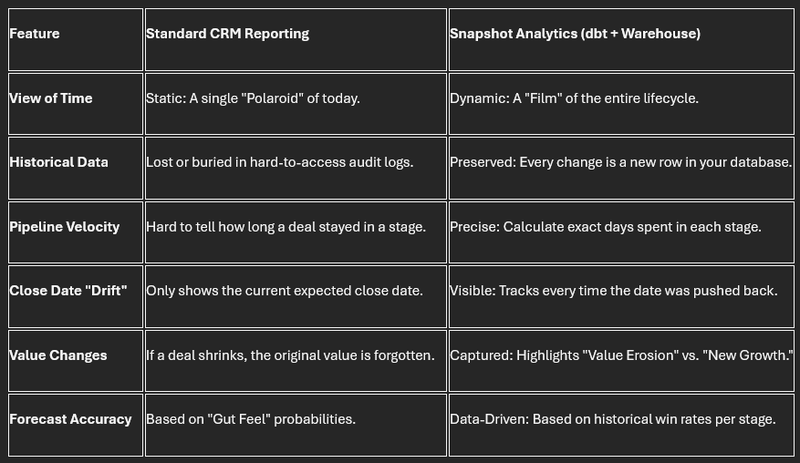
Comparison: Standard CRM vs. Snapshot-Based Analytics
The following table provides a quick look at why moving your data is a game-changer:
Key Analytics You Can Now Perform
Once you have this historical grain, you can build reports that were previously impossible:
A. The Waterfall Analysis (Bridge Report)
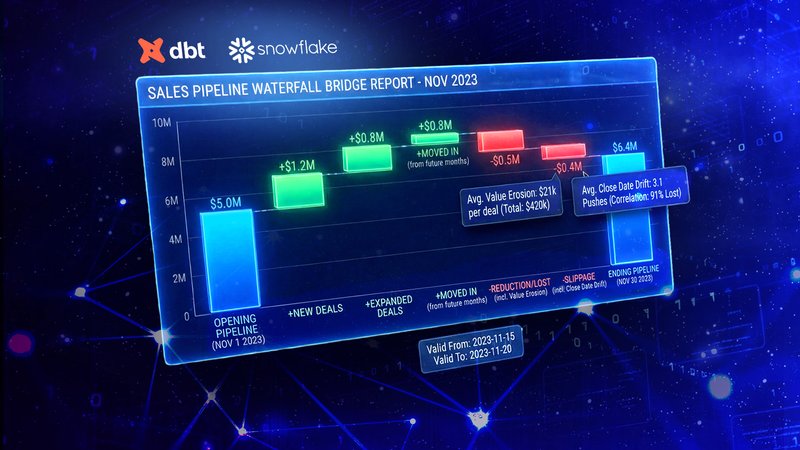
This is the "Holy Grail" of sales ops. It explains exactly why the pipeline changed between two dates:
- New: Deals created during the period.
- Expanded: Existing deals that increased in value.
- Moved In: Deals that were expected to close later but moved closer.
- Reduction/Lost: Deals that shrank or went to "Closed Lost."
- Slippage: Deals that were supposed to close this month but moved to next month.
B. Stage Probability Validation
Sales reps are often optimistic. By looking at history, you can calculate Actual vs. Stated Probability. For example, if reps mark "Discovery" as 20% likely to close, but historical data shows only 5% of deals in that stage actually reach "Closed Won," you can apply a "Data-Driven Discount" to your forecasts for better accuracy.
C. The "Close Date" Drift
You can track a counter for every time the Close_Date field is edited. A deal that has had its close date pushed 4 times is statistically much less likely to close than a deal that hasn't moved, regardless of what the rep says.
The Bottom Line
The takeaway for your audience should be: Don't trust the dashboard; trust the trend. You don’t need to be a data engineer to appreciate the power of a snapshot. By pairing a modern Data Warehouse (like Microsoft Fabric, Snowflake or BigQuery) with dbt, you are essentially giving your business a memory.
Moving your sales data into a Warehouse using dbt isn't just a technical upgrade—it’s a move from "guessing" to "forecasting." You stop reporting on where you are and start analyzing how you got there. Implementing this isn't a year-long project. With dbt and a modern Data Warehouse like Microsoft Fabric, Snowflake or BigQuery, you can start snapshotting your key opportunity tables in a matter of hours.
The data you save today is the insight you'll use to win tomorrow.
Want to see the dbt code we use to set up these snapshots? Reach out to the Dynamic Data team for a template.