
BI platforms evaluation: Preset
In this opportunity, we bring you a real gem, an open source-based Business Intelligence software with great potential.
Preset Cloud is a cloud-hosted and fully managed service platform for data exploration and visualization built on top of the popular open-source project, Apache Superset.
Our evaluation

8 (out of 10)
Preset combines two things that don't always go together: the strength of a massive open-source project — Apache Superset is now past 74,000 stars and 18,000 forks on GitHub — and the backing of a company, Preset, that contributes more than 75% of the commits to the project. It's not a reseller: it's the team keeping the engine running.
Among the features we liked most: a robust and flexible security layer through role-based access control and row-level security; a genuine semantic layer (not something every tool ships with out of the box); more than 40 ready-to-use visualization types; a powerful SQL editor alongside a friendly visualization builder that doesn't require writing a single line of code; and cross-filtering, drill-to-detail, and drill-by capabilities to dig into the data without leaving the dashboard.
And, of course, the fact that it's an open-source tool: you're not attached to any company — you can run your own standalone Superset instance — and it constantly benefits from third-party contributions.
That said, there are still points that call for some technical know-how: while you can build an entire dashboard without SQL, developing a solid semantic layer or managing security in depth still requires some technical assistance.
Features Overview
Preset always runs the latest, battle-tested version of Superset, so you have access to all the best features that Superset has to offer. They manage and maintain the newest Superset installation, including the underlying message queue, asynchronous celery workers, multiple caching layers, SMTP email server for supporting alerts & reports, and a well-monitored observability solution.
Apache Superset is an open-source software cloud-native application for data exploration and data visualization. It started as a result of a hack-a-thon back in 2017. It’s a modern, lightweight, cloud-native, free, and open-source BI web application with an advantageous SQLAlchemy python backend, making it scalable and compatible with almost any database technology speaking SQL. Several companies quickly adopted and adapted it as part of their top modern data stack layer (Airbnb, Lyft, Twitter, Netflix, Amex).
Dropbox also adopted Superset, and they have written an interesting article about this adoption and the reasons behind their decision. They centered on Superset’s ability to get answers without using SQL, create viz quickly, the possibility of sharing virtual tables and metrics, the security features, and the flexible API for creating custom visualizations. They shared a table with their findings comparing several tools that you can see here.
Characteristics
Preset comes with six main UIs that are the core of it:
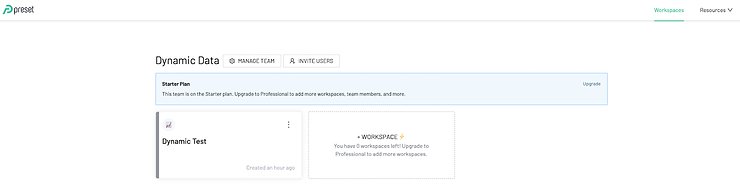
- Workspace Screen: It's a way to group correlated data in database connections, datasets, charts, and dashboards. A workspace is simply a collection of all content shared between yourself and others. There's a limit on the number of workspaces you can have.
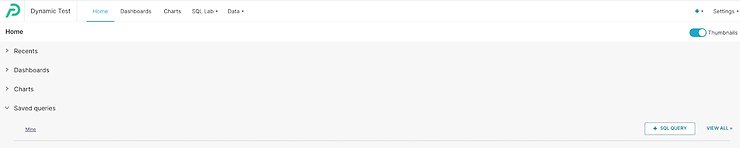
- Home Page: It collects all everyday actions such as Recents Panel, Dashboards Panel, Saved Queries Panel, and Charts Panel.
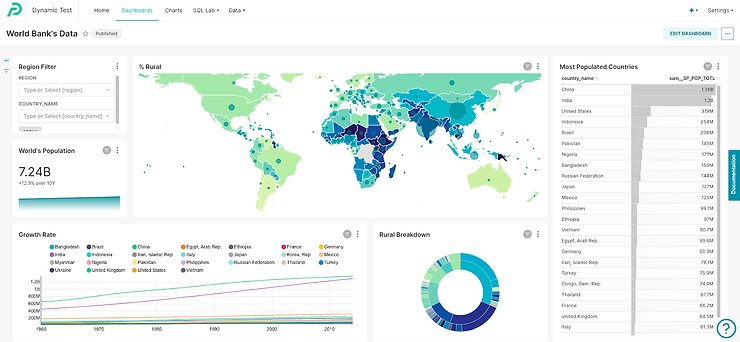
- Dashboard Screen: It's where you'll fix all your charts in a layout, along with filters and other features.
- Charts: It’s used to create a visualization. Preset offers a very vast selection of visualizations that allow you to show your data in different ways.
- SQL Lab: Here you can create queries, access saved queries, and review the query history.
- Data: All your databases and datasets are managed in this section.
1. Types of Users
- Administrator: manages access to teams (or organizations), access to workspaces, and has access to all information in workspaces.
- User: connects to a team based on an invitation and access to a workspace based on provided permissions.
The typical workflow for an administrator providing role-access control are:
- Invite a user to a team using an email invite.
- Give the user access to a workspace role. There are several roles for a user in a workspace. New roles can be added on-demand if you contact support.
- Add the user to data access roles: you can create a role, add users to that role, and grant permission on databases, schemas, tables, and/or queries.
- Finally, control data access with row-level security: this powerful feature enables you to exert a granular level of control over who can query—and view—specific data in selected datasets or tables. It is usually combined with data access roles. The two filter types can be applied. Regular filters add where clauses to queries if a user belongs to a role referenced in the filter. Base filters apply filters to all queries except the roles defined in the filter and can be used to define what users can see if no role-level security filters within a filter group apply to them.
2. Database Connections
It supports a wide range of modern databases, such as Google BigQuery, Amazon Redshift, Snowflake, Databricks, Azure Synapse, MySQL, PostgreSQL, Google Sheets, and more. A recent and relevant addition: it now also supports MongoDB, allowing you to run SQL queries against Mongo collections, on both MongoDB Atlas and self-hosted deployments. It's Superset's first concrete step outside the purely SQL world.
3. Alerts and Reports
An alert delivers a snapshot of a chart or an entire dashboard on demand, and is triggered when an event occurs, for example, when a threshold value is exceeded. That event is defined with a SQL query that returns a unique value, such as a count. Alerts are delivered via email and/or Slack, with a visual snapshot of the chart or dashboard and a link to its Explore page.
Scheduled reports have improved quite a bit recently: they can now include file attachments in CSV, Excel, PDF, or PNG screenshot format. On top of that, Preset announced on August 5, 2026 that scheduled reports now honor the exact tab and filters applied on a multi-tab dashboard, so a single dashboard can feed several different reports — each with its own view — without exporting anything by hand. Notifications can also be sent to any HTTP endpoint via webhook, in addition to email and Slack.
4. Support and Documentation
- Knowledge Base: online documentation and videos covering the basics of the tool.
- User's corner: a dedicated YouTube channel covering several topics.
- Assistance through a bot: you can open a support ticket, schedule a meeting with a support team member, and chat online with an agent 24/7.
5. Semantic Layer
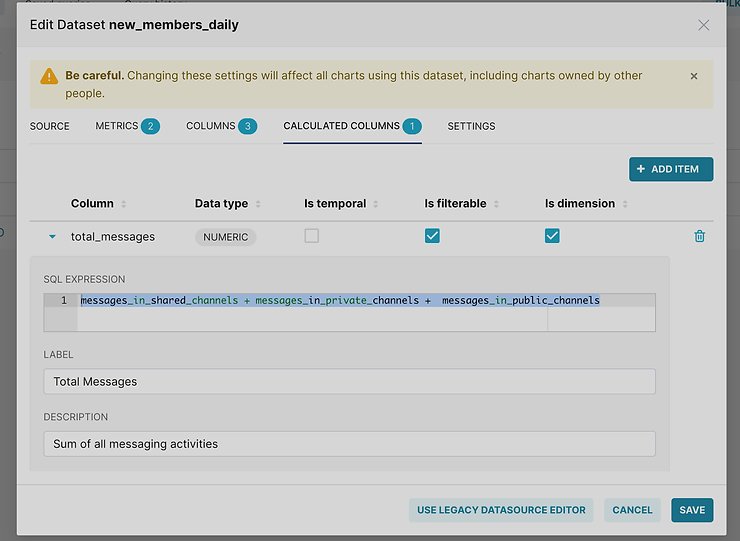
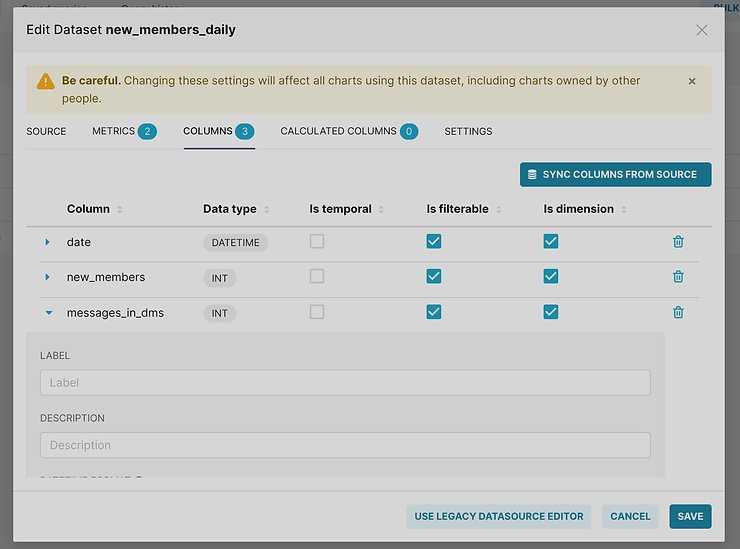
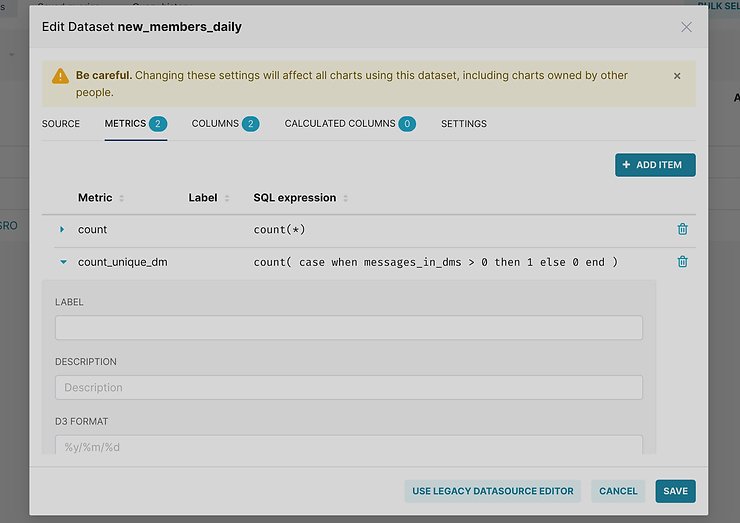
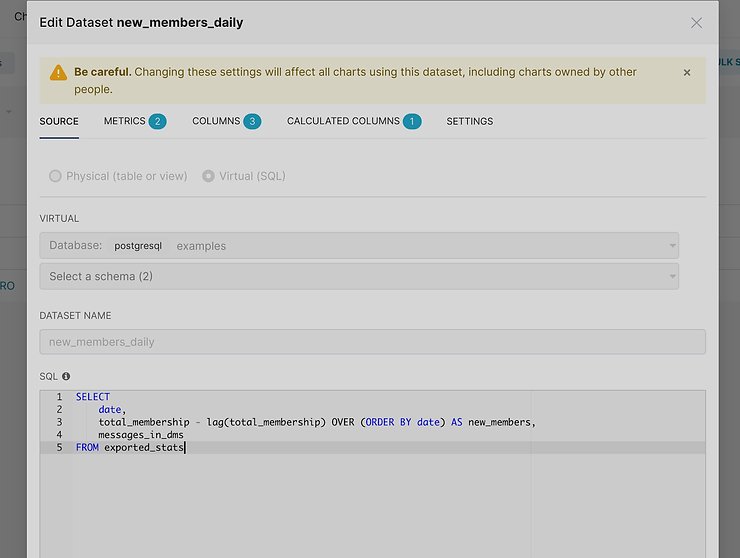
All datasets you add to Preset can be customized. These customizations will appear in the dataset panel; you can group data as needed (if applying metrics) and then create charts. You can also add the following items to your dataset:
Metrics: define the metrics logic used in aggregated rows or when pivoting rows into columns. You can easily modify the metric’s name, the label, the SQL expression for the calculation, a description, D3 Format of the metric, a warning message, a certification (organization or a person), and certification details. If the metric has a warning or a certification, icons and additional information will appear when you explore the dataset.
Columns: you can select what columns to show or not, an alias, data type, date format, and several boolean settings such as if it's a date if it's filterable, or a dimension.
Calculated Columns: you can use this for transformation, enrichment, or data validation, same editable fields that those in the column are available here, plus SQL expression.
6. Charts
Preset comes with a wide variety of charts (40+ and growing), organized into five categories:
- Time Series Charts: line charts, time series bar charts, and time series tables.
- Composition Charts: bar charts, pie charts, and treemaps.
- Distribution Charts: histograms, box plots, and horizon charts.
- Relationship Charts: pivot tables, heat maps, and bubble charts.
- Geospatial Charts: scatterplots, arcs, grids, and polygons.
Preset includes a dataset explorer, so you can easily explore the data and play with different charts to build the right visualization. It's a complete and flexible tool for browsing your data and exporting it in several formats (JSON, CSV, image).
Another exciting feature of some charts is advanced analytics, which groups together different functions to further process the data after it's been pulled from the database:
- Rolling Window: lets you use a statistical value to represent the values, such as mean, sum, standard deviation, or cumulative sum.
- Time Comparison: compares the same data series with a time shift, using actual values, absolute difference, or percentage change.
- Python Functions: data fetched from the database is loaded into a pandas DataFrame to apply analytics functions in scenarios where advanced analytics isn't supported, when data is missing, or to group data by period and show values based on a defined method.
7. Dashboards
Dashboards are a way to group related charts, and the same chart can be added to more than one dashboard. The dashboard screen is configured in a grid layout composed of rows and columns, and you can add a row or column indistinctly to create space for your charts.
Within a dashboard, the Filter visualization type lets you filter data across all of the dashboard's charts directly, with the option to choose which charts it affects. Preset's Dashboard Filters offer an intuitive interface to quickly apply a variety of filters across the whole dashboard from the sidebar.
One improvement worth highlighting: dashboards now come with cross-filtering, drill-to-detail, and drill-by capabilities — you can click on a point in a chart to automatically filter the rest of the dashboard, or drill into a specific row's detail without leaving the view.
Dashboard content can be organized into different tabs for navigation and presentation, giving you the flexibility to arrange charts in a way that makes sense. If you add a markdown component, you can customize it using markdown, CSS, and/or HTML. You can insert images and completely change the look and feel of a dashboard using CSS.
8. SQL Lab
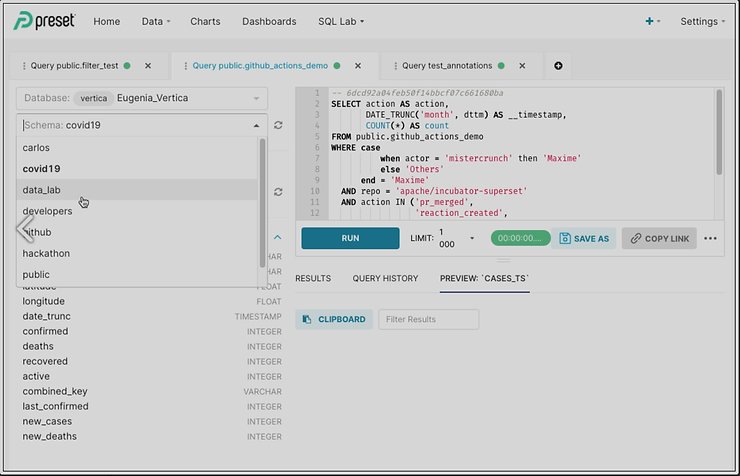
The SQL Lab is the workspace for users to manage all aspects of SQL usage in their Preset environment. It's a useful tool that gives you a multi-tab environment to work on multiple queries at a time. It allows you to browse your database, support long-time running SQL queries, historical logs of queries, and support templating using the Jinja templating language, which allows for using macros in your SQL code.
The SQL Lab consists of three tools: SQL Editor, Saved Queries, and Query History.
SQL Lab also supports templating (programmatic capabilities) via the Jinja Framework, which is a web template engine for the Python programming language. Besides the flexibility provided in terms of SQL generation, templating is mainly used to increase the power of Preset filter functionality. For instance, if you need to filter data for the currently logged user, change dynamically filters in a dashboard URL, process formatted data coming from a field, or to personalize dashboards.
9. Preset Embedded SDK
With a straightforward deployment, we can integrate dashboards created into external applications to enrich the user experience, turning it into an interactive analytics experience. To protect our infrastructure, Preset offers a variety of security features to provide flexible access control.
10. Preset CLI: Dashboards as Code
Preset CLI lets you export databases, datasets, charts, and entire dashboards as YAML files, sync them across environments, and even integrate them with dbt Core or dbt Cloud projects. The most recent release came out in April 2026, so it's still under active development. One honest detail: on PyPI it's still classified as "Development Status: 4 - Beta," even though in practice it already has years of real-world use and a fairly complete feature set.
11. Preset MCP and Artificial Intelligence
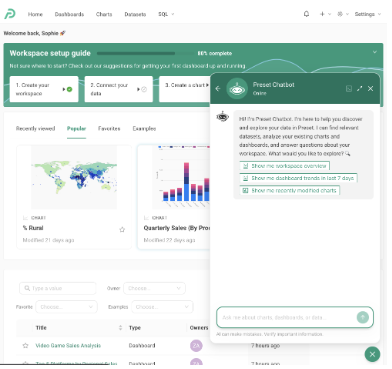
The most notable addition in this evaluation: Preset launched Preset MCP, an integration built on the Model Context Protocol that lets an AI agent — Claude, or another compatible client — build charts, put together dashboards, run SQL, and explore datasets directly on top of Superset, respecting the same permissions and row-level security already configured. For anyone who'd rather not set up an external client, there's also Preset Chatbot, a conversational assistant built directly into the interface.
Two clarifications before you get too excited: Preset MCP is available only to Enterprise customers, and Preset Chatbot is still in beta, available on request.
General Limitations
Preset doesn't allow you to build visualizations from multiple tables within its Data Exploration layer without writing some SQL to build a virtual dataset that joins them.
Although you can design the semantic layer without using SQL, some definitions still require basic SQL knowledge. It would help to have a broader technical setting that lets non-SQL users extend the models and create charts and dashboards with more autonomy.
Support for NoSQL sources remains limited: MongoDB is now a concrete exception, but the tool doesn't offer broad native support for the rest of the NoSQL ecosystem.
Superset doesn't have natively integrated Python or R notebooks for more flexible, advanced analysis — unlike some other BI tools that do — though it does let you connect to third-party notebook tools, like Jupyter or Databricks. It does offer some limited Python functions for use when building certain chart types. The newer AI capabilities (Preset MCP) and version control capabilities (Preset CLI) also aren't available on every plan: the former requires an Enterprise plan, and the latter still carries a beta classification.
Frequently Asked Questions
Does Preset already support drill-down on dashboards? Yes. Apache Superset added cross-filtering, drill-to-detail, and drill-by features: you can click on a point in a chart to filter the rest of the dashboard, or drill into a row's detail without leaving the view.
Can a Preset dashboard be version-controlled like code? Yes, through Preset CLI, which exports and imports databases, datasets, charts, and dashboards as YAML files, syncs them across environments, and integrates with dbt Core or dbt Cloud projects. It's still listed as beta on PyPI, though in practice it has years of real-world use.
Does Preset support NoSQL databases? Partially. It added support for MongoDB, allowing SQL queries to run against Mongo collections. It's not native support for the entire NoSQL ecosystem, but it's a concrete first step outside the purely SQL world.
Do scheduled reports now support filters and file attachments? Yes. They can include attachments in CSV, Excel, PDF, or PNG screenshot format, and as of August 2026 they also honor the exact tab and filters applied on a multi-tab dashboard.
Does Preset have any artificial intelligence capabilities? Yes, it's called Preset MCP, and it lets an AI agent — like Claude — build charts and dashboards directly on top of Superset, respecting the same permissions and security already configured. It's available only to Enterprise customers; the built-in Preset Chatbot is still in beta.
This wraps up our evaluation of Preset. As most BI platforms keep evolving fast, we'll likely need to revisit it again soon.
See you in the next review.
Dynamic Data.