

BI platforms evaluation: Mode Analytics
Mode is an online analytics platform with powerful integrations that help data scientists push analysis further and build specialized visualizations.
In 2023, Mode was acquired by ThoughtSpot for $200 million. Today it still operates under its own brand, site, and documentation at mode.com, and works as the code engine (SQL, Python, R) behind ThoughtSpot's natural-language search layer. The company put it this way when announcing the acquisition: "Mode isn't going away. In fact, we will invest more heavily in it with the combined resources of both companies".
Our evaluation

7 (out of 10)
Mode is an interesting and powerful tool, especially if you factor in the Python and R integrations. We see it as best suited for companies with technical people, such as BI developers, data scientists, and front-end developers. It's not as friendly for regular business users, since they'll need solid knowledge of SQL, Python, R, HTML, CSS, and JavaScript to unlock the full power of Mode. It has a security layer, but nothing fancy: it uses collections and database permissions, but there's no security at the schema, table, or row level.
You can also schedule (or subscribe to) reports. You can set a specific timetable to send an email or a Slack message, attaching HTML, CSV, and PDF. Filters added to the report aren't available at the moment of creating the schedule. If you need to filter your data, you have to create parameters, add default values, and add those parameters to the queries. Then you can change the parameter values in the scheduler. One thing to note here is that reports update on demand, so if you want to update them ahead of time, you can create a schedule to refresh the data at specific times.
While most visualizations for day-to-day use are available and intuitive, some more advanced chart types offered by other BI tools are still missing on the platform (for example, clustered stacked bar charts). Something positive about the Mode team is that they're extremely receptive to user feedback and constantly evolving to add new features. Also, there are a lot of libraries (most of them free) to use; again, specialized help may be needed.
We also found some lag time for data to load when there are multiple charts in the same report, or when changing filters/parameters. This lag when processing a report doesn't happen when designing a chart, whereas that wait time is something we did find in other tools.
Two interesting features are paid as an extension to the annual licensing: external embedding (doesn't require users to be logged in to see the charts), and external sharing (through the scheduling feature). The pricing for these features is similar to the licensing itself, so if you want them you need to pay, on average, three times your annual license.
Features overview
1. Databases and Workspaces
Mode lets you easily create different workspaces to organize users, data, and dashboards.
Different data sources can be connected to Mode, such as MySQL, PostgreSQL, Redshift, Snowflake, BigQuery, Databricks, Azure SQL Database, and many more — today the list also includes ClickHouse, Oracle, and Teradata. It also offers a Bridge connector option if the data sits behind a firewall, VPN, or VPC.
2. User Management
The default login options are username and password, Google, Office365, and a SAML provider of the administrator's choice. For automatic user provisioning via SCIM, the integration today is specifically named for Okta and Azure Active Directory; other SSO providers can still work through generic SAML, but they no longer show up as named integrations in the current documentation.
Security is made up of a combination of private Collections (groups of reports) and database connection permissions, to control view and edit access to reports. Groups can be created with a unique set of permissions to control access to specific database connections and/or collection memberships.
You can also set specific permissions for users to access databases. The different kinds of access are view, query, and manage.
3. SQL editor
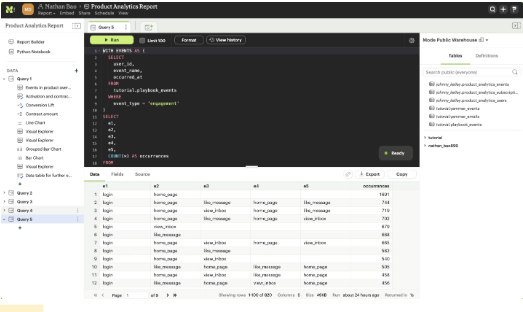
The editor is intuitive and straightforward to use. It lets you select a database (there's a helpful search function). The editor itself comes with code highlighting and formatting, shortcuts, a pretty good autocomplete feature, query history where you can see the performance of your query, how the SQL renders, and error debugging.
4. AI Assist
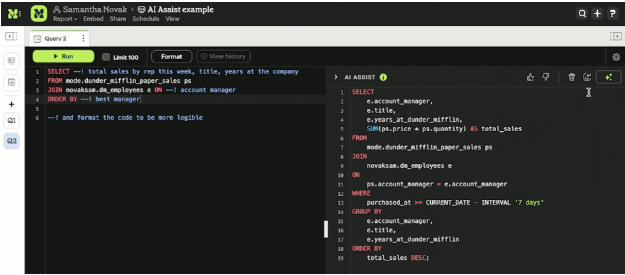
Inside the SQL editor, Mode has a feature called AI Assist that helps write queries faster. The logic is simple: instead of writing all the code by hand, you add a special comment with --! describing what you need, and the tool completes the rest. For example, starting with:

AI Assist generates the rest of the query — the JOIN, the sum calculation, the GROUP BY — ready to review and run. One important detail: it's still a tool for someone who already knows their way around the SQL editor, not a way for someone without technical knowledge to "ask" the data something directly; you need to name at least one real table for it to work. It runs on OpenAI's GPT-3.5T and GPT-4T models, and today it's turned on account by account, by request.
5. Semantic layer
Mode still doesn't offer a single, all-in-one semantic layer, but today there are three distinct pieces that cover that need:
Definitions: these are reusable SQL snippets — custom SELECT statements that can be referenced in any query to share business logic in one place. The Liquid language and parameters are available to build them. The limitation is that you have to run a new query every time they're referenced, and they don't support use without writing SQL.
Datasets: these are curated tables reusable across multiple reports, refreshed and materialized independently in Mode's data engine (Helix). Unlike Definitions, a Dataset runs once and its results feed every report that uses it, which improves performance and reduces the load on the warehouse. Datasets support documented field descriptions and calculated fields, and can be explored without writing SQL once published.
dbt Semantic Layer integration: Mode has a specific integration with dbt's semantic layer that exposes your company's governed metrics for exploration and self-service, ensuring everyone sees the same number for a given metric. Unlike a Dataset, a dbt metric's logic runs through dbt's SQL proxy every time, so each metric chart executes independently.
As an additional note, there's also Data Mashup: it lets you join data from different sources — different cloud data warehouses, or flat files like CSV or Google Sheets — within a single report, without needing an upfront ETL process to centralize them. This solves a real limitation Mode used to have, where you could only join tables from the same connection. For now, this feature only works joining Datasets with each other (SQL-based or Google Sheets flat files), not any report.
6. Visualizations
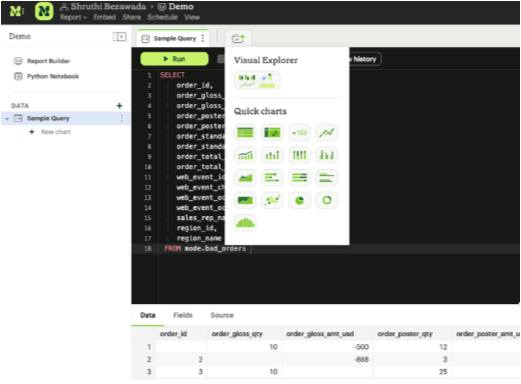
After a SQL query runs successfully in the SQL editor, the next step is to choose a visualization. Some common options are table, bar, line, scatter, area, and pie charts. You can set filters at the chart level, and choose currency, labels, date format, percentage format, colors, granularity, aggregate functions, etc.
Every SQL result can be related to several different visualizations.
Mode comes with the ability to create calculated fields that can be used across all your visualizations within the same query. New metrics can be built at the visualization layer, on top of aggregations.
7. Visual Explorer
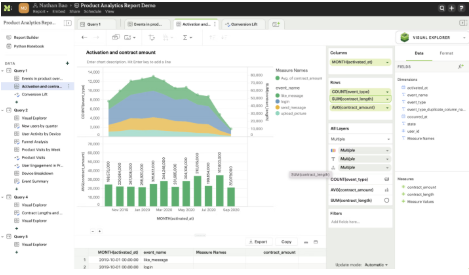
For those who need more control over the final result, Mode offers Visual Explorer: a way to build charts based on layers and rules (inspired by the Grammar of Graphics), meant as a more flexible alternative to fixed-view charts when the standard report falls short. It runs on an in-memory compute engine called Helix, supports pivot tables, multi-facet combo charts, calculated fields, and is designed as a code-free entry point for anyone in the company to explore data quickly, not just technical users.
8. Notebooks
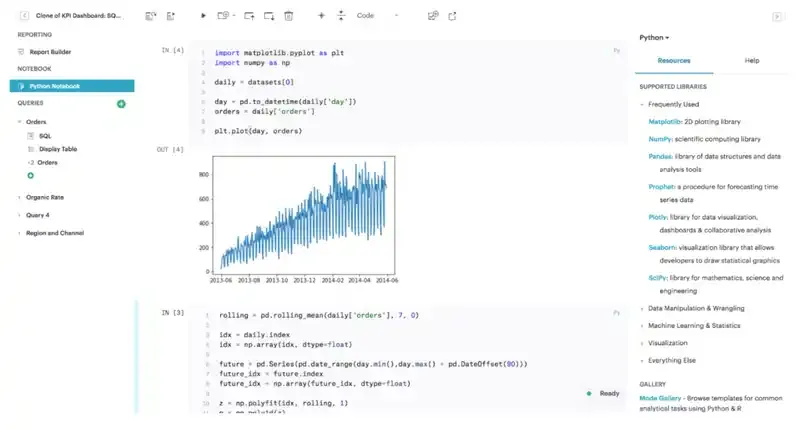
After getting your query results, another way to continue the flow, instead of one of the visualizations Mode provides, is to use the Notebooks feature. The notebook environment enables rapid code iteration for data manipulation, statistical analysis, and advanced visualization using powerful languages: Python and R. This is helpful for experienced users who want to push conventional SQL-based analysis past its limits.
One of the best advantages here is having different SQL queries pulling from different databases and combining those datasets in your Python or R code.
Finally, there are a lot of custom visualizations in those languages that you can include in your report/dashboard. There are also several pre-loaded Python and R libraries ready to use in your code. Additional libraries can be added manually if needed.
9. Report/Dashboard
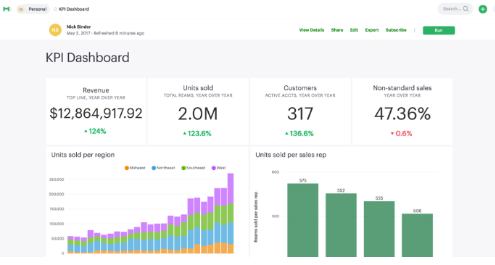
Following the Mode flow, after creating your queries and having all the visualizations you need, you can use the "Report Builder," which offers a simple interface for dragging and dropping components into a simple grid.
There are a lot of themes you can use to customize colors, fonts, and styles.
This editor also comes with an HTML editor to modify the underlying HTML and CSS of the report layout. By editing the report's HTML, you can create visualizations using libraries like D3.js or Mode's own JavaScript library, alamode.js.
10. Report sharing
To wrap up the flow, you need to share your reports with stakeholders. There are multiple ways to do this. First, all members of a collection can have access to your report. Then you can share them by email with other workspace members. The email can include a report preview, an HTML table summary, links to the report, or CSV or PDF.
They can also be shared using a Slack integration, or by sharing the report link (last run or a specific run).
There's also a scheduling feature. You need to create your queries by adding as many parameters as needed in the query. Those parameters can then be given a value when setting up the schedule. There's still no filter support when using the scheduler.
Finally, you can embed your reports into existing sites or applications. To reinforce security, you can restrict users' ability to see specific data.
11. Webhooks
Webhooks are used to notify other applications when events happen within the Mode environment. They're frequently used to trigger other applications through tools like Zapier, to alert users when a Mode report run finishes, and for enhanced logging of activity within Mode.
12. Github
Another useful integration is Github. Once you've created a new report, you can simply click to have all your changes committed to your repository, and you can even write a comment to keep updates documented. Pushes are mostly automatic at the moment of modification, but you need to commit new reports. The Github integration syncs standard definitions, reports, or themes to all Mode users in the workspace. Your repository works like any other Github repository: you can branch, modify, and then merge into master (to make the changes visible in Mode). Worth noting: today this sync only covers SQL-query-based Datasets, not every content type.
13. Mode's API
Mode also offers an API that can be used or integrated into your applications. Some of the most commonly used functions are collection and workspace management, granting permissions, report administration, manipulating SQL queries, filters, exporting results via JSON, CSV, or PDF, and managing schedules. The API also has webhook support to automate tasks with tools like Zapier.
14. Embedding
An Internal Embed, built with your private data, is only visible to logged-in members of your Mode Workspace who would otherwise have access to the underlying report. It can also be embedded, for example, in a private wiki. You need a user account for each member of your company who will have access to that wiki, and they need to make sure they're logged into Mode in another browser tab.
A White-Label Embed (WLE) is the other option they offer. You need this feature if you're sharing embedded reports with users who aren't logged into Mode, or users who don't have access to the workspace where the report lives. Some minimal processing is required on your host site to manage security and pass values to parameters (for example, only showing regional data, or values belonging to a particular customer). Generally, WLE lets you view reports without Mode's branding, but with reduced interactivity for the viewer (for example, some drill-down features are disabled). You can also enable/disable downloading CSV data from the underlying report results. CSS is supported if you need to change the style of your embedded report. Some elements (a chat, a title, etc.) can also be hidden. Lastly, it's worth mentioning that reports can be embedded into a Salesforce page layout as a VisualForce page.
15. dbt data integration
Mode's dbt integration lets you view metadata about data freshness from dbt directly in Mode reports. The integration lets Mode users show information about when the source data for a report was last refreshed, by mapping the tables used in the report to dbt models.
16. Collections
To organize all that work, Mode uses Collections: every report and every Dataset lives inside one, meant to group content by team, project, or theme. Each user also has their own personal collection, and workspace admins can define who can create new collections or connect databases.
Frequently Asked Questions
Is Mode Analytics still a standalone product in 2026? Yes. It still operates with its own site, documentation, and brand at mode.com, even though it's been part of ThoughtSpot since the 2023 acquisition.
Does AI Assist replace the need to know SQL? No. AI Assist helps write queries faster inside the SQL editor, using natural-language comments with --!. It's still a tool for someone who already knows SQL, not a way to ask the data questions without technical knowledge.
Does Mode have row-level security? No. Mode's security is handled through private collections and database connection permissions; there's no native security at the schema, table, or row level.
What is Visual Explorer? It's a way of building charts based on layers, meant as a more flexible alternative to fixed-view charts, with an in-memory compute engine (Helix), designed as a code-free entry point for non-technical users.
Is it still a good option for working with Python and SQL in 2026? Yes. For technical teams, the SQL editor, AI Assist, and the Python and R notebooks remain some of its strongest features.
Thanks for reading, and more BI platform evaluations are coming soon.
Dynamic Data.