

Fabric Apps: When a Dashboard Isn't Enough
There's a moment every data team knows well. The dashboard is live, the numbers are right, and then someone asks: “great, can I approve it from here?” And the answer is no. The dashboard shows; it doesn't do. Doing happens somewhere else, in another system, an email, a spreadsheet.
Closing that distance used to mean building a custom application. That meant hosting, authentication, security reviews, deployments, and weeks of platform work before the first screen ever shipped. For most internal tools, that price was a death sentence. The request went to the backlog and stayed there.
Fabric Apps, now in preview, is Microsoft's answer to that problem: full custom applications that live inside Microsoft Fabric, right next to the data, without the infrastructure bill.
What Fabric Apps is
Fabric Apps lets developers build modern web applications as native Fabric items, the same way a report, a lakehouse, or a semantic model is an item. The app appears in your workspace, opens from the Fabric portal, and is governed by the same permissions as everything else in it.
You write the application code, and the platform takes care of the rest. Users open it with their company account (single sign-on included); the app queries your data live, and there is no separate server, domain, or login system to build or maintain.
For data teams, the interesting part is what these apps can do that reports can't: accept input, save decisions, trigger processes. They're applications in the full sense, not visualizations.
A Quick Technical Overview
Without going deep, this is what's under the hood and why it matters:
Standard web technology. Apps are TypeScript/React projects, scaffolded from a template with one command. Any web developer (or, notably, an AI coding assistant) is productive immediately. This is a pro-code surface: it's not where your analysts work; it's where your developers do.
Native connection to semantic models. The data-app template connects directly to the Power BI semantic models you already curate, with charts and data grids included. The app queries the model as the person viewing it, so your existing data permissions keep working. And with Direct Lake models, what the app shows is what the lakehouse holds right now, no refresh schedule involved.
An optional generated backend. When the app needs to store something (an approval, a comment, an adjusted forecast), the platform can generate a small database and API for it. This is the piece that turns a viewer into a tool.
One-command deploy. Publishing is a single CLI command and about a minute. The code lives in git like any software project, with tests, versioning, and review.
What it Costs to Run
This part is refreshingly short. Fabric Apps has no separate meter: apps run on the Fabric capacity your workspace already uses, and hosting the app itself consumes next to nothing. What does consume capacity is the same thing that always did: queries against your semantic models, now coming from app users instead of report viewers. For a team-sized internal audience, the cost is noise. For an app that becomes everyone's morning routine on a small capacity, plan the headroom, as you would for any popular report.
Infrastructure-wise, the trade is clear: Microsoft manages hosting, scaling, certificates, and authentication end to end; you own the code, the tests, and the permissions. No servers to patch, no cloud resources to babysit. The flip side is less control: no custom domains or networking rules today. You take the platform as it comes.
Where it Fits: Use Cases
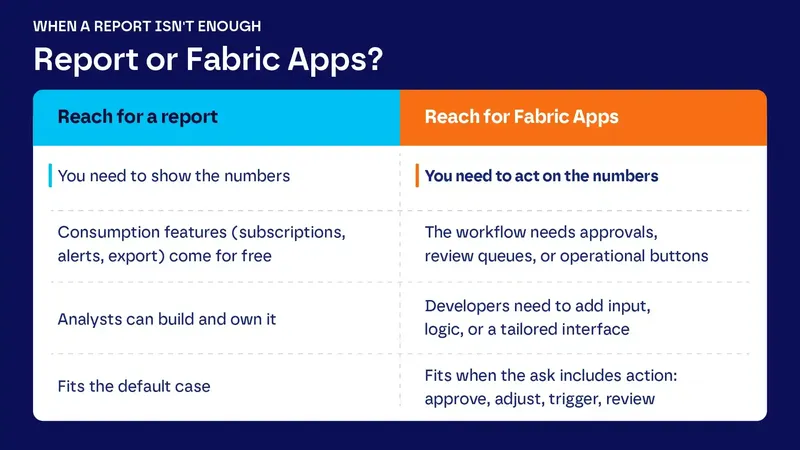
The default for a new data requirement is still a Power BI report: faster to build, analysts own it, and consumption features come for free. A Fabric App earns its place when the requirement includes action:
- Approval and review queues. Approve, reject, or flag items next to the live data that supports the decision.
- Operational consoles. Buttons that do things: retry a failed process, acknowledge an alert, grant access.
- Input alongside data. Forecast adjustments, targets, commentary, saved where the numbers live instead of in a satellite spreadsheet.
- Interaction logic a report can't express. Custom filters, compound conditions, auto-refresh behaviors, views that adapt to the user.
- Front ends for AI workflows. A tailored interface over an agent or an internal AI service, with its own state and logic.
The rule of thumb we use: reports to consume data, apps to act on it.
What We're Doing With it
We put Fabric Apps to work for a client on exactly that pattern: operational dashboards that don't just display, but participate in the workflow. The first one monitors live telemetry (usage, errors, latency, adoption) straight from the lakehouse, with filtering and refresh behavior a standard report couldn't express. It's the foundation for consoles where the team acts on what they see: reviewing items, triggering checks, acknowledging issues, all in the same screen.
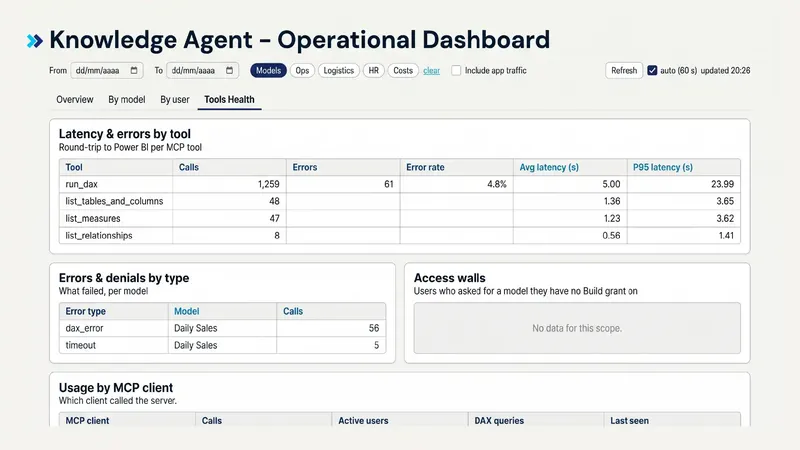
A few numbers from that experience tell the story.
The application itself took about three hours to build; the full chain, from data pipeline to deployed app, about a day. The equivalent tool on our own cloud infrastructure had been scoped in weeks.
That difference changes which tools get built at all: requests that used to die as “can't justify the platform work” now fit in an afternoon.
It also confirmed something we expected: the development experience is unusually good for AI-assisted coding. The templates ship with guidance that coding agents understand, and what you test locally is exactly what renders in production. We built ours almost entirely with an AI assistant, with a developer reviewing and polishing. When writing an internal tool becomes that cheap, the economics of the long tail flip: tools that never justified a platform build suddenly do.
The Bottom Line
Fabric Apps is in preview, and it shows in places: regional availability is partial, and the platform will keep moving before GA (general availability). None of that changes the core: for targeted internal tools over data you already trust, built by developers and used by teams already working in Fabric, it's ready to try today.
If your dashboards keep ending in “now let me go do something about this elsewhere,” pick one of those workflows and close the gap. That's the whole promise: the place where your team sees the problem can finally be the place where they fix it.
If you want a second opinion on whether one of your workflows is a good fit for this, or want to see the template we used to scope ours in a day, get in touch, we're happy to walk you through it.
Written by Marco Luquer
Data & AI Architect