
We Tried Claude Dashboards: Fast to Build, and Only as Good as the Data Underneath
On October 8, Anthropic launched Claude Dashboards in beta, and we couldn't resist trying it the same week. The idea is simple: you connect a data source, ask a question in plain language, and Claude writes the queries and builds the dashboard for you. Here's what we saw.
We Let Claude Go First, Then Told It Who the Dashboard Was For
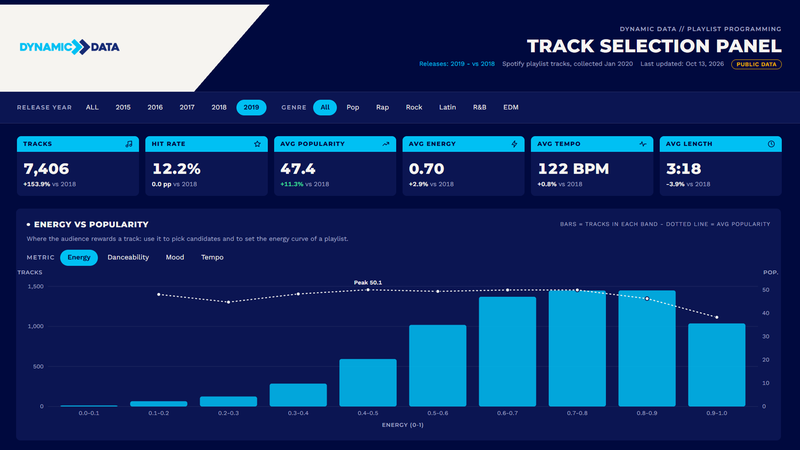
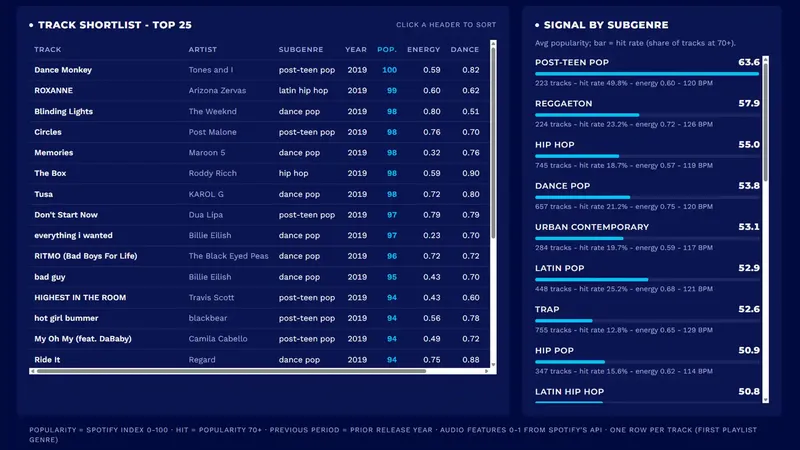
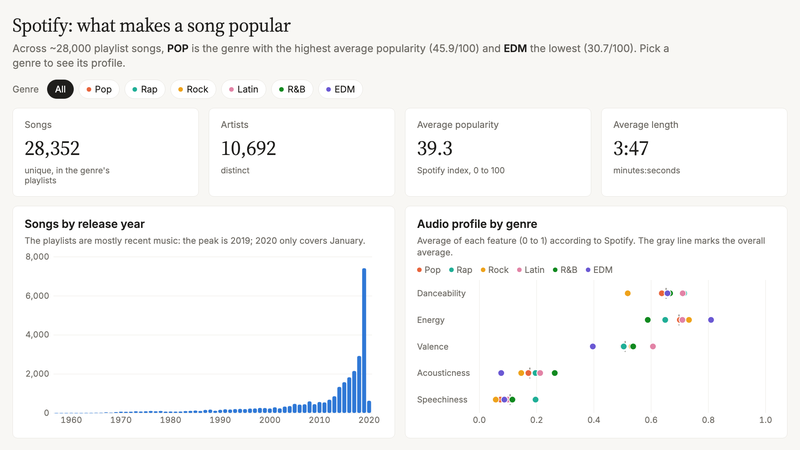
For our test, we connected Claude to a public Spotify dataset. We didn't want to judge the tool on our own prompting from the start, so the first version was Claude's call entirely: no instructions beyond asking for a dashboard.
Claude did a good job. It picked sensible KPIs for a general overview of the data, chose chart types that suited each one, and gave the dashboard a clear storyline, from the headline numbers down to the detail. If what you need is a first look at a dataset you don't know yet, that's already useful. That's exactly where Anthropic positions it: quick, exploratory questions, like how this month's signups by channel compare with last month's.
The catch is that a good general summary isn't the same as the dashboard someone actually needs. Left on its own, Claude tells a good story with the data, but it doesn't necessarily answer the questions the dashboard's audience has. For the second version, we wrote a more specific prompt, spelling out who the dashboard was for and which questions it had to answer, and the results were better. That matches Anthropic's own advice: say what you want to know, not just what to chart. It's also what we tell clients before any build: start from the decision, not the chart.
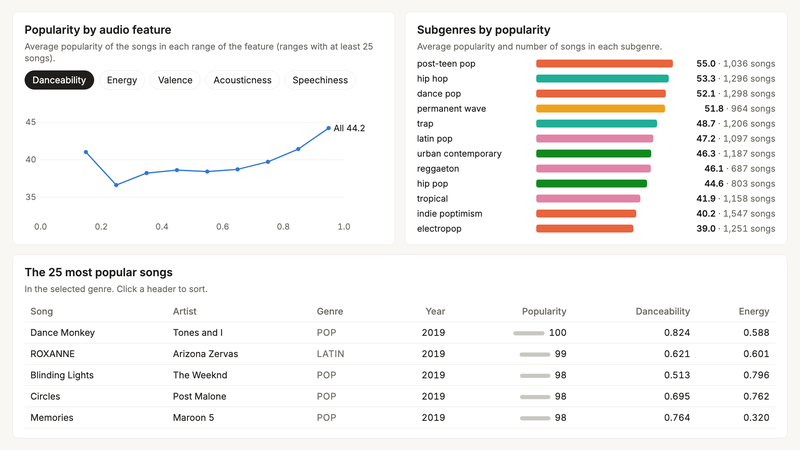
Both versions had one thing in common, and it's what makes the numbers checkable: nothing is hidden. Claude writes a query for each chart, and each chart shows that query and when its data was last refreshed. You can click any number to see the query behind it, or ask Claude to explain it. For an analyst, that's the difference between a chart you have to trust and one you can verify.
From Dashboard to a Short Video with Claude Motion
A dashboard isn't always the best way to tell the story, so we also tried the other half of the launch. Claude Motion turns your content into short animations, such as an explainer for an all-hands or an animated chart for a board deck.
In our test, we found two ways to get from a dashboard to a video. The first is to ask a question and have Claude put together an explanation or analysis based on the dashboard, presented as a video. The second is more precise: leave comments on specific charts saying which animation you want for each one.
What comes out isn't generated footage. Motion doesn't use a video generation model; instead, Claude writes code that animates your text, charts, shapes, and images, so you can change any word, number, or timing without touching the rest. You can ask Claude for changes or adjust the animation directly in the editor, then download it as an MP4. Two practical notes before you plan around it: Motion is in beta on Team and Enterprise plans only (on Enterprise, an owner has to turn it on first), and longer or more complex animations use more of your plan's usage limits than regular messages.
It Reads Your Data with Each Viewer's Own Permissions
Claude Dashboards works on top of the data you already have. You can connect a data platform such as Amazon Redshift, BigQuery, ClickHouse, Databricks, or Snowflake, and it also works with other apps you've connected to Claude, such as Salesforce.
That design has a consequence for sharing that's easy to miss. Dashboards start private, and you share them from the Share button. But an artifact that pulls from connected apps uses the viewer's connections, not yours. The technical reference Claude follows when it builds a dashboard is more specific: each live query runs with the viewer's own access, whenever the dashboard is opened, refreshed, or filtered.
From a governance point of view, that's good news: the dashboard doesn't become a back door to data someone shouldn't see. In practice, though, it means sharing the link isn't enough. If your sales lead needs to see the numbers, they also need access to the dataset and their own connection to it. Plan for that before the review meeting, not during it. On Enterprise plans, there's one more step: Dashboards is off by default until an owner turns it on.
Every View Runs a Query, Unless You Save the Results
Running with each viewer's access also means running for each viewer. A live query runs again every time someone opens the dashboard, refreshes it, or changes a filter, and your warehouse bills each run like any other query. On BigQuery's on-demand pricing, for example, you're charged for the bytes each query processes, so the same chart can cost very different amounts depending on whether it reads a large raw table or a small one prepared for it.
The alternative is to stop a query from refreshing automatically and keep its results saved in the dashboard. That saved copy is updated in one of two ways: someone asks Claude to refresh it, or a scheduled Claude routine refreshes it on a set cadence. The dashboard also knows how often the copy should be refreshed, and it flags the data as stale once that window passes. Any editor can make the query live again from the Sources panel. It's a sensible way to spare your warehouse, but it comes with two trade-offs.
The first: a query that changes with a filter can't be saved. It has to stay live, because one saved copy can't follow the filter.
The second matters more. When a query isn't refreshing automatically, everyone who can open the dashboard sees its saved rows, whatever their own access. The permission model we described above no longer applies to that data. For a public dataset, that's fine. For payroll, pipeline, or customer data, decide deliberately which queries you save and who gets the link.
What Makes It Cheap, and Right Is Underneath It
Claude Dashboards is a strong tool. It gets you from a question to a working dashboard in hours, and being able to read the query behind every number keeps it honest. It also doesn't try to replace your BI platform: when a question needs deeper analysis, you can send the dashboard straight to tools such as Hex, Omni, or Sigma.
In our view, though, every one of those strengths depends on the data underneath. Accuracy depends on Claude finding clean, well-named tables with clear definitions; otherwise, it has to guess which column means "revenue" or how to deduplicate records. And cost depends on how much data each query processes, every time each viewer opens the page. Claude's own reference for building dashboards says it plainly: because each live query runs again for every viewer, a smaller or already aggregated table is the better source when it has the answer.
That's the part no prompt can fix. A well-modeled warehouse, with aggregated tables prepared for the questions your team actually asks, is what turns Claude Dashboards from an impressive demo into something you can rely on every Monday morning.
Let's Get Your Data Ready for It
That's the work we do at Dynamic Data. We model your data in your warehouse, build the aggregated tables your dashboards need, and set up the dashboards themselves, whether that's in Claude, Looker Studio, Power BI, or the BI tool you already use. If you want to try Claude Dashboards on your own data and get the foundation right from day one, let's talk.
Frequently Asked Questions
Which data sources does Claude Dashboards connect to?
Data platforms such as Amazon Redshift, BigQuery, ClickHouse, Databricks, and Snowflake, plus other apps you've connected to Claude, such as Salesforce.
If I share a dashboard, does everyone see the same numbers? Not for live queries. They run with each viewer's own access, so what each person sees depends on what they can reach. Saved results are different: everyone who can open the dashboard sees them, whatever their own access.
Which plans include it? It's in beta on Pro, Max, Team, and Enterprise plans. On Enterprise, an owner has to turn it on first.
Written by Belén Rumie
Principal Consultant - Data Strategy & Platform