

BI platforms evaluation: Metabase
Metabase is an easy, open-source way for everyone in your company to ask questions, generate embeddable charts, build interactive dashboards, learn from data, and make decisions. In addition, you can quickly summarize and visualize your data without writing a line of SQL or having to wait on a coworker for help. Browse or search through tables, then filter things down to find just what you need. Move from data to professionally looking graphs and charts with just a few clicks. Metabase provides a GUI query builder and an efficient SQL interface to dig into the complicated stuff.
Our evaluation

6 (out of 10)
Metabase is as good as it gets considering its price, but it still has a long way to go to be at the top of our preferred BI platforms. Dashboards and charts look pretty engaging. Still, we didn't love the UI; it could be confusing and slow querying your DB in the desktop version. Although Metabase provides easy ways to get results for non-technical users, its flexibility is poor, its filters are tricky and not entirely useful, and, as of the current version, it is impossible to merge databases.
We have also found some bugs when interacting. For instance, modifying questions or visualizations kept data of previous modifications. So, you need to log out or go home and hard refresh.
Features overview
1. SQL Editor
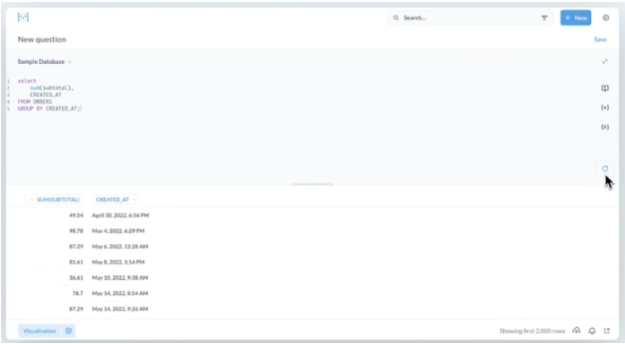
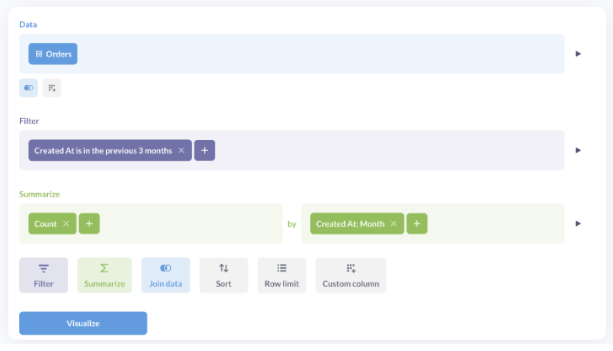
Metabase presents itself as a zero-code tool for creating dashboards and visualizations, and for complex queries, you can use SQL. The terminology has changed from earlier versions: today the official docs describe two paths for building a query ("question"): the Query builder (the graphical editor, with custom expressions similar to spreadsheet formulas and the ability to join tables) and the Native query editor, the SQL editor itself, called "native" because it can also query non-SQL databases like MongoDB.
SQL console:
Query builder:
When creating a question, you cannot connect to different databases simultaneously; once a database is selected to create the question, you need to keep working with the same database. Inside the SQL editor, there's a feature called Snippets to reuse and share bits of SQL across different queries, without having to rewrite them each time.
2. Datasets (Today: Models)
The queries are called questions, and you can save and use them within new questions, allowing you to standardize datasets. The current official documentation uses the term Models for this function: they curate data from one or more tables in the same database to anticipate the types of questions people will ask about that data, and they function as a derived table or a starting point for new queries. An important point: the documentation itself clarifies that Transforms (see point 15) are the successor to Models, and that Metabase will gradually replace them, today you can even convert existing Models to Transforms in bulk.
It has a feature called X-rays, a fast and easy way to get automatic insights and explorations of your data. You can click on a point in a chart and choose "Automatic insights" (with the X-ray or Compare to the rest options), or directly request the X-ray of a whole table or Model from the Browse Data button. Either way, Metabase automatically generates charts that summarize the data based on the field types it finds, and if you find it useful, you can save that X-ray as a new dashboard with one click. When you connect a database for the first time, Metabot will also offer to show you some automatic explorations of that new data.
We also have Segments and Metrics. Segments are just a set of filters you apply to a table (no joins allowed). Once created, it will be available when creating a new question (as a filter). Metrics work like pre-defined calculations: you build your aggregation once, save it as a metric, and reuse it whenever you need to analyze that data — today, they can also live in a Library of standardized metrics inside Data Studio (see item 15), so the whole team uses the same definition.
3. Dashboards
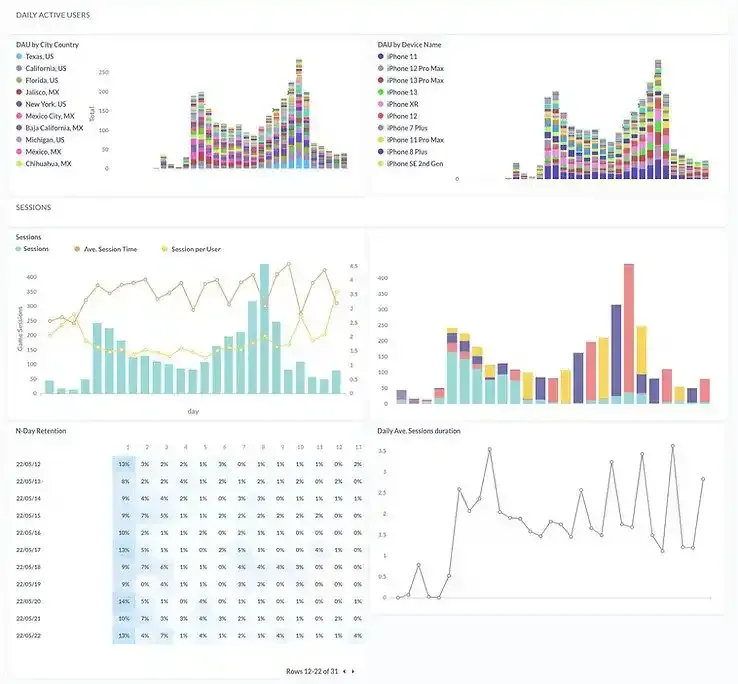
You can easily create and use interactive dashboards (click on charts and drill down, or set values to filters). The official docs also name cross-filtering as a click-behavior option: making a click on a chart update a filter across the whole dashboard.
Results can be exported directly from dashboards. Hovering over a dashboard card and opening the three-dot menu shows a "Download results" option, with CSV, XLSX, JSON, or PNG (if it's a chart) formats. In addition, the whole dashboard can be exported as a PDF from the Share button.
4. Filters
When creating parameters in your queries to filter your data, the available types are text, string, numerical operators, date, typical time ranges, relative ranges, and numbers. Also, you can filter by excluding a certain period of time from any period. It has one more filter a little more flexible called a Field Filter. It must be attached to a particular column (where it gets the element's context to select). Also, not all types of columns can be used as a field filter; the following are not supported: avatar image URL, description, email, enum, a field containing JSON, number, latitude, longitude, URL.
5. Sharing
Dashboard subscriptions are scheduled dashboards you can send via email or Slack. They can include attached CSV or xlsx files, with a default limit of up to 1,048,575 rows (Excel's row limit), configurable if you self-host your instance.
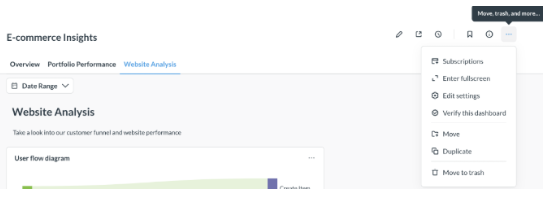
On Pro and Enterprise plans, filter values can be customized for each dashboard subscription separately, for example, sending a marketing lead the view filtered by "Marketing" and "this week," while at the same time sending upper management the unfiltered view by department with "this quarter," from the same dashboard. On the Starter/open-source plan, on the other hand, the subscription keeps using whatever default filter values the dashboard has.
Another feature related to dashboard subscriptions is that updates can be sent on specific queries to a Slack channel or through email. For Pro and Enterprise plans, Admins can see all subscriptions and alerts set up in their instance, and they can also restrict the domains to which Subscriptions and Alerts can be emailed.
You can also share public dashboard links, and share your dashboards with the included embedded dashboard feature. On top of that, a PDF of the full dashboard can now be attached to a subscription, following the dashboard's layout exactly as it appears on screen.
6. Alerts
It has a few different alerts you can set up: when a time series crosses a goal line when a progress bar reaches or goes below its goal, and when any other kind of question returns a result. Alerts can be set using email or Slack.
7. Security
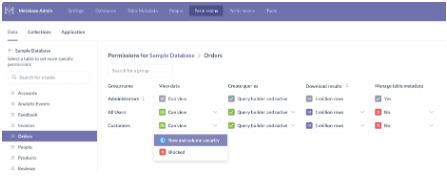
Metabase allows you to create users and assign those users into groups. Groups can have restricted/granted access at a table level in a database, and today there's also more granular row and column level security: you can restrict which rows a group sees within the same table by filtering on a column (for example, so each customer only sees their own records). There's also separate column-level permissions. You can also set permissions to access collections (a set of queries/questions) by group, and SSO authentication via SAML to manage which groups each person belongs to based on their identity provider.
8. Support
Metabase has a discussion forum where users can get help on installation, set up, share tips and tricks, report issues, or ask for help. Support varies by plan: the Starter plan includes email, support-form, Slack, or Teams support with a 3-day response time; the Enterprise plan adds a 1-day SLA and a dedicated success engineer. It also has a demo video to see "Metabase in action," documentation, and Twitter, GitHub, and YouTube accounts where you can find tutorials and user guides. Still, Metabase has significantly fewer tutorials and community support than other equivalent tools.
9. Analytics
You can use R or Python to analyze the data, and easily access data from your Metabase questions. Python has a library: metabasepy and there is a similar library for R: metabaser.
10. Privacy: (Usage Data Preferences)
If you allow it, Metabase may collect data about product usage to help them improve. Metabase never collects any information regarding your data or questions results. All collection is completely anonymous and can be turned off at any point in your admin settings.
11. Performance of Big Tables / Visualization of Big Tables
If you work with large data, filter views and dashboards tend to load very slowly. Databases are truncated after 10 thousand rows. A chart doesn´t support more than one hundred series of data.
12. App Integrations
It could use some more documentation about integrating dashboards into applications through a basic iframe. For more advanced customization needs, see item 14, Modular Embedding SDK.
13. Metabot AI
Metabase built AI into the whole platform, available on all plans, including the open-source version.
Metabase offers three ways to use AI:
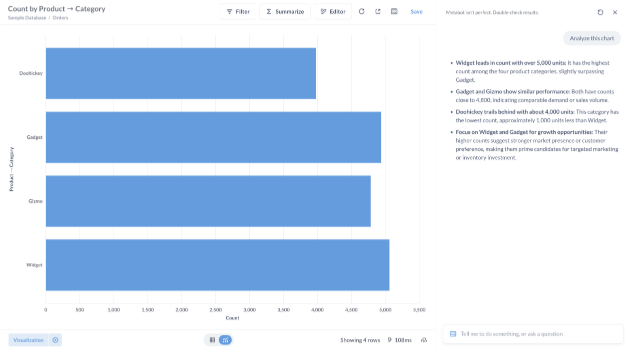
- Metabot (the section of that same page called "Metabot"): the built-in AI agent, meant for daily tasks inside Metabase. The docs say verbatim: "Metabot can help you with most daily tasks around Metabase, like answering questions about your data, creating queries, generating SQL code, explaining charts, or creating Documents."
- MCP Server (the "MCP server" section of the same page): for connecting third-party AI tools — the docs specifically name Claude and Codex, and mention "Cursor, etc." — directly to Metabase, useful for combining Metabase data with data from other MCP-connected tools. It has more limited functionality than Metabot (for example, it currently can't generate code or build Transforms). Available on all plans.
- Agent-driven development workflow (the "Agent-driven development workflow" section): using a coding agent like Claude Code together with the Metabase CLI to create content directly in a development instance and version it as YAML. Requires a Pro/Enterprise plan.
Every AI answer links back to the underlying query, so you can inspect it, open it in the notebook or SQL editor, and edit it if needed — it's not a black box. AI respects the permissions you've already set up, and runs against your warehouse without Metabase ingesting, storing, or syncing your data.
You can choose your own AI provider with your own key: Anthropic, OpenAI, AWS Bedrock, or Microsoft Azure, or use Metabase's built-in model (available as a Cloud-only add-on) if you don't have a preferred one.
14. Modular Embedding SDK (for React)
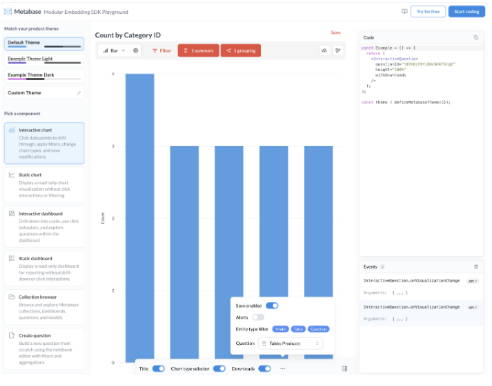
Metabase launched a modular embedding SDK, built for React applications (React 18 or 19, Node.js 20 or higher), available on Pro and Enterprise plans, both self-hosted and on Metabase Cloud. With this SDK you can embed individual Metabase components — standalone charts, dashboards, the query builder, and more — managing access and interactivity per component, with advanced style customization. You can also embed an AI chat (a more focused version of Metabot) directly in your application, with the same permission restrictions as each end user.
Among the SDK's current limitations: it doesn't support verified content, official collections, dashboard link cards, or server-side rendering (SSR); and you can only have one dashboard per application page (though you can embed several standalone questions on the same page).
15. Data Studio: semantic layer and Transforms
In March 2026, Metabase introduced Data Studio, a workspace for analysts to structure data and build a shared semantic layer. It's where you define models, metrics, and a glossary of shared business terms, so a metric like "ARR" (annual recurring revenue, a common metric for subscription businesses) means the same thing to Metabot as it does to the rest of the team, and that same semantic layer is what makes AI's answers trustworthy.
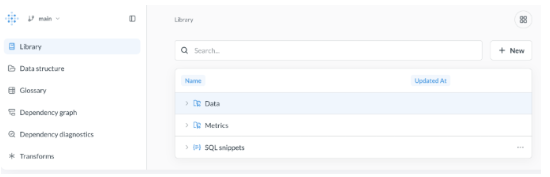
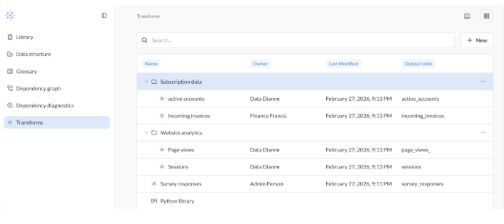
Data Studio is also home to Transforms: queries (in SQL or with the query builder) or Python scripts that write their results back to your database, creating a new, persistent table that can be reused as a source for other questions or other transforms, it's the "T" in "ETL," done inside Metabase. Transforms are scheduled with tags and jobs, support incremental updates (only processing new rows), and on Pro/Enterprise plans can be versioned in Git as YAML files. Today they work on BigQuery, ClickHouse (Cloud only), MySQL/MariaDB, PostgreSQL, Redshift, Snowflake, and SQL Server.
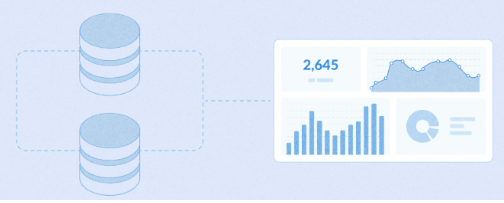
One important detail: combining data from different databases is not something Metabase solves natively. The documentation explains it this way: Metabase isn't a storage or query engine, and joining data from two different databases would require pulling that data into Metabase's memory, which doesn't scale well. The recommended solutions are at the database or infrastructure level: building a data warehouse, using Foreign Data Wrappers in PostgreSQL, creating mirror views in MySQL or Snowflake, or using a federated query engine like Presto, Trino, Starburst, or Athena.
Specs summary
- Tool type:
Cloud analytics solution.
- Pricing:
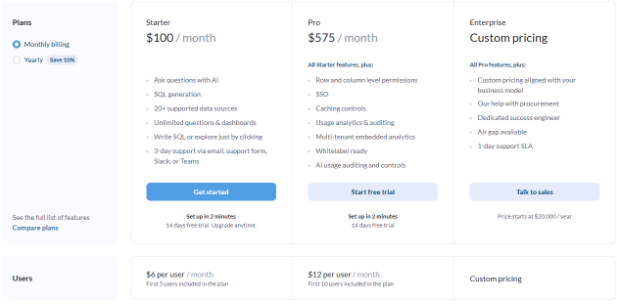
There are three plans: Starter, at $100 per month (includes 5 users, then $6 per additional user); Pro, at $575 per month (includes 10 users, then $12 per additional user), with row and column-level permissions, SSO, and multi-tenant embedded analytics; and Enterprise, with custom pricing starting at $20,000 per year, with dedicated support and a 1-day SLA. Using AI with Metabase's own provider, and Transforms beyond the included runs, are billed separately based on usage.
- Plans:
Cloud Based: Starter, Pro, and Enterprise. On-premise platform: Open source, Pro, and Enterprise.
- Trial:
A 14-day free trial is still available for most plans.
- Data sources:
Amazon Redshift, Apache Spark, BigQuery, Druid, Google Analytics, Microsoft SQL Server, MongoDB, MySQL, Oracle Database, PostgreSQL, presto, Snowflake, SQLite, Vertica.
- Desktop options:
JAR files, Docker, and MAC app.
- Cloud options:
Metabase Cloud, AWS Elastic Beanstalk, Heroku, Debian as a service, and Kubernetes. Since desktop and cloud options are stand-alone tools, you cannot work in your desktop version and push it to your cloud environment.
Frequently Asked Questions
Does Metabase allow exporting data directly from a dashboard? Yes. You can download each dashboard card as CSV, XLSX, JSON, or PNG, and export the whole dashboard as a PDF.
What is Metabot? It's Metabase's AI assistant, available on all plans (including open-source). It answers natural-language questions, generates and explains SQL, and runs on Anthropic, OpenAI, AWS Bedrock, or Azure models depending on the provider you choose.
Can Metabase be embedded in your own application with more control than an iframe? Yes, with the Modular Embedding SDK for React (Pro and Enterprise), which lets you embed individual components — charts, dashboards, the query builder, and even an AI chat — with style customization and per-component interactivity control.
Can you join data from two different databases inside Metabase? Not natively. This remains an explicit limitation of the tool; it needs to be solved at the infrastructure level (data warehouse, Foreign Data Wrappers, mirror views, or a federated query engine).
What are Data Studio's Transforms? They're SQL queries, query-builder queries, or Python scripts that write results back to your database as a new, reusable table, similar to the "T" in an ETL process, with scheduling support, incremental updates, and Git versioning.
This finishes our evaluation of Metabase. More BI platforms reviews are coming soon.
Dynamic Data.